Do you need to create intuitive, easy-to-read dashboard that integrate quarterly sales and survey data for analysis? If you do, Ragic can help generate these reports; but if you prefer to use other tools such as Microsoft's Power BI, you can also export the data in Ragic and make charts like this:
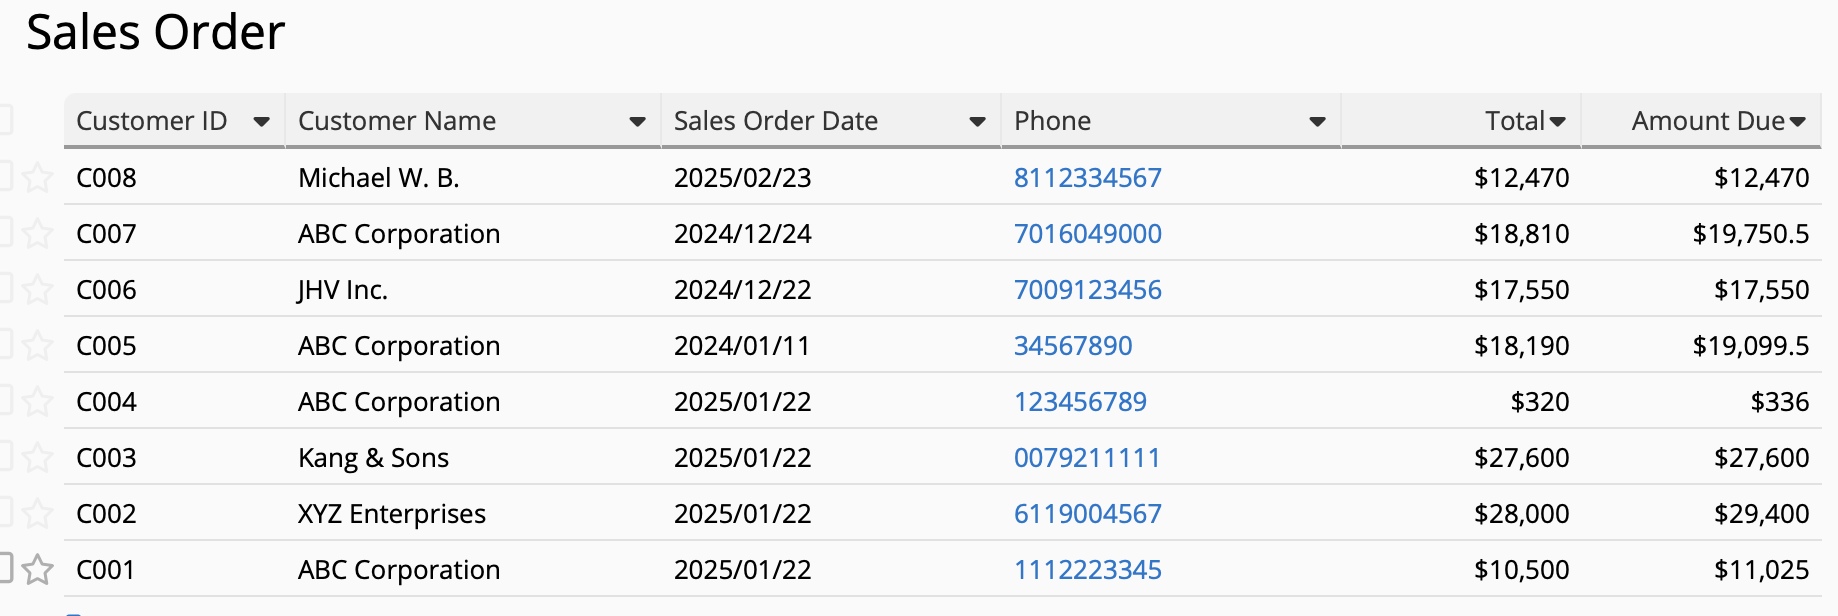
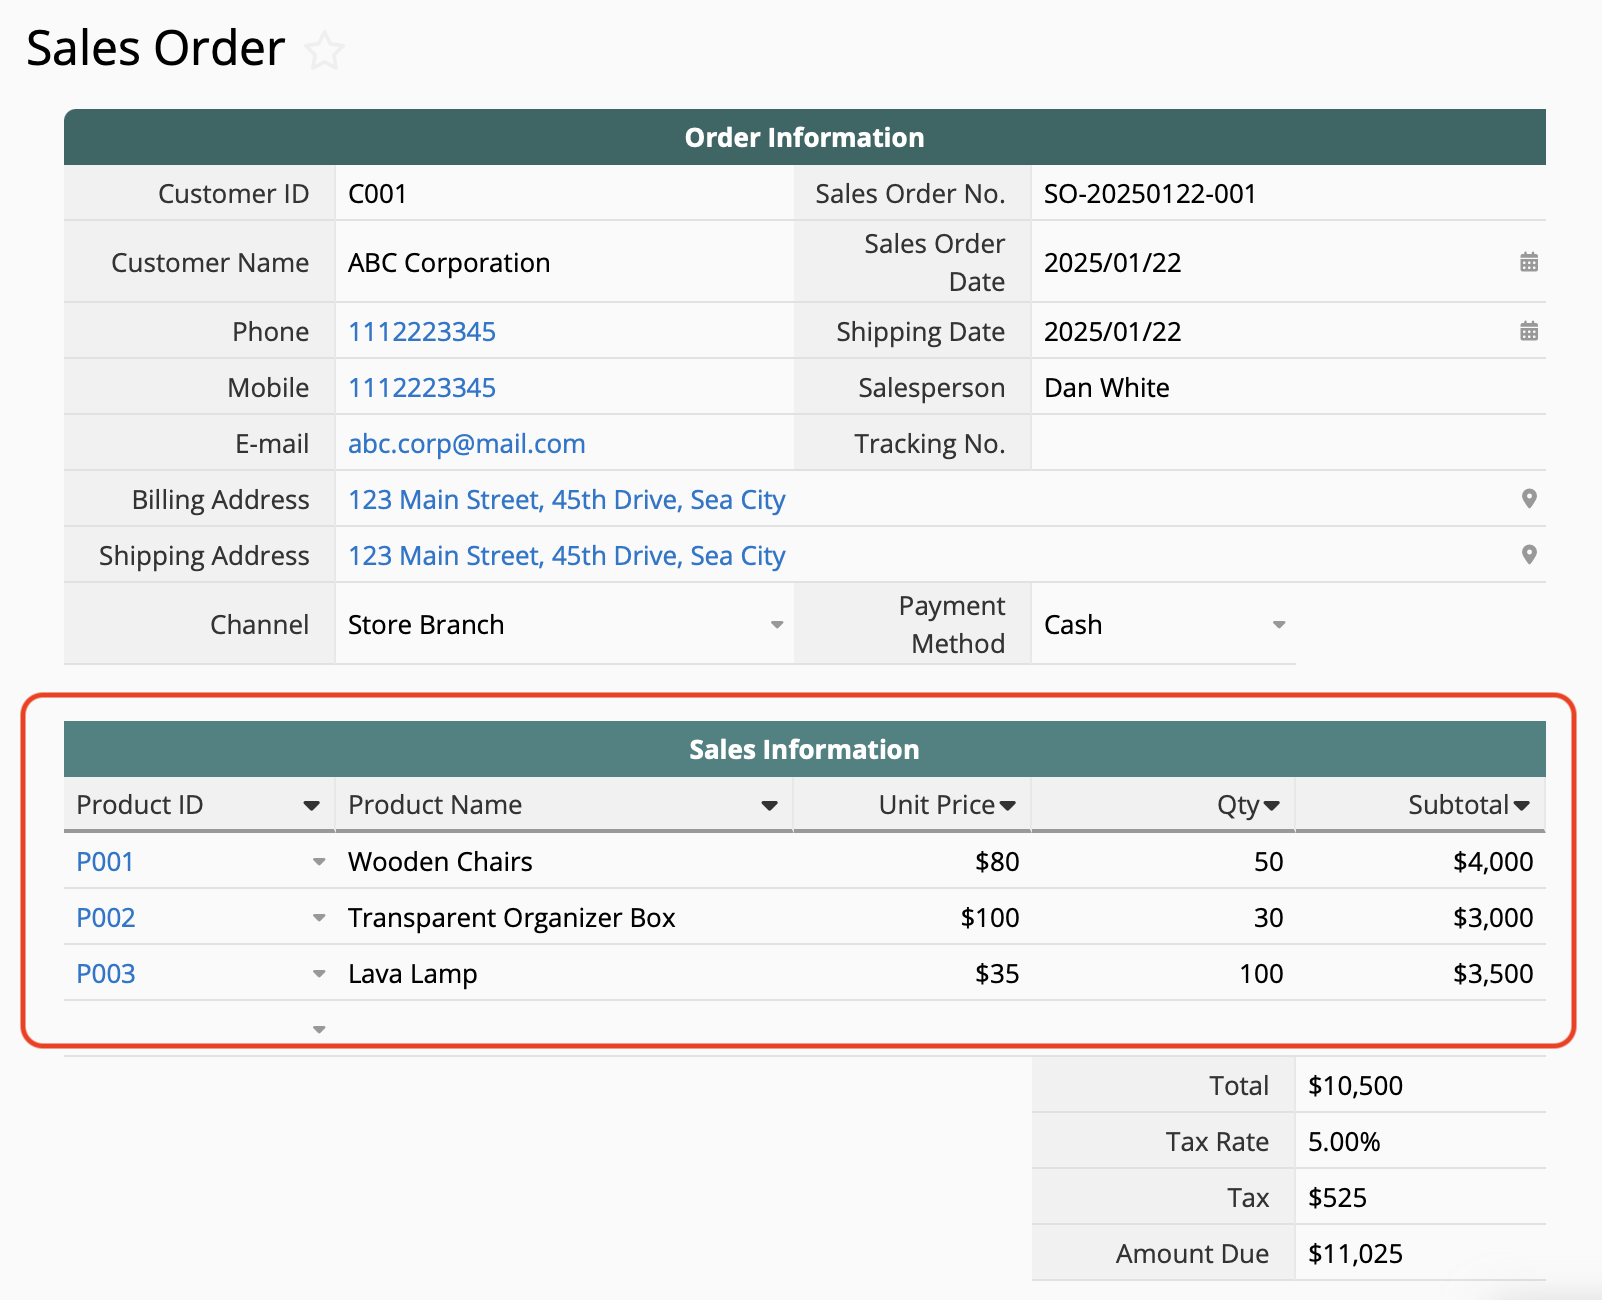
Let's take the "Sales Order" in the image below as an example. In addition to exporting the data as CSV file to Power BI online (Power BI Service) and Power BI desktop versions, we will also use the Publish to Web function to update the data to Power BI desktop in real time.
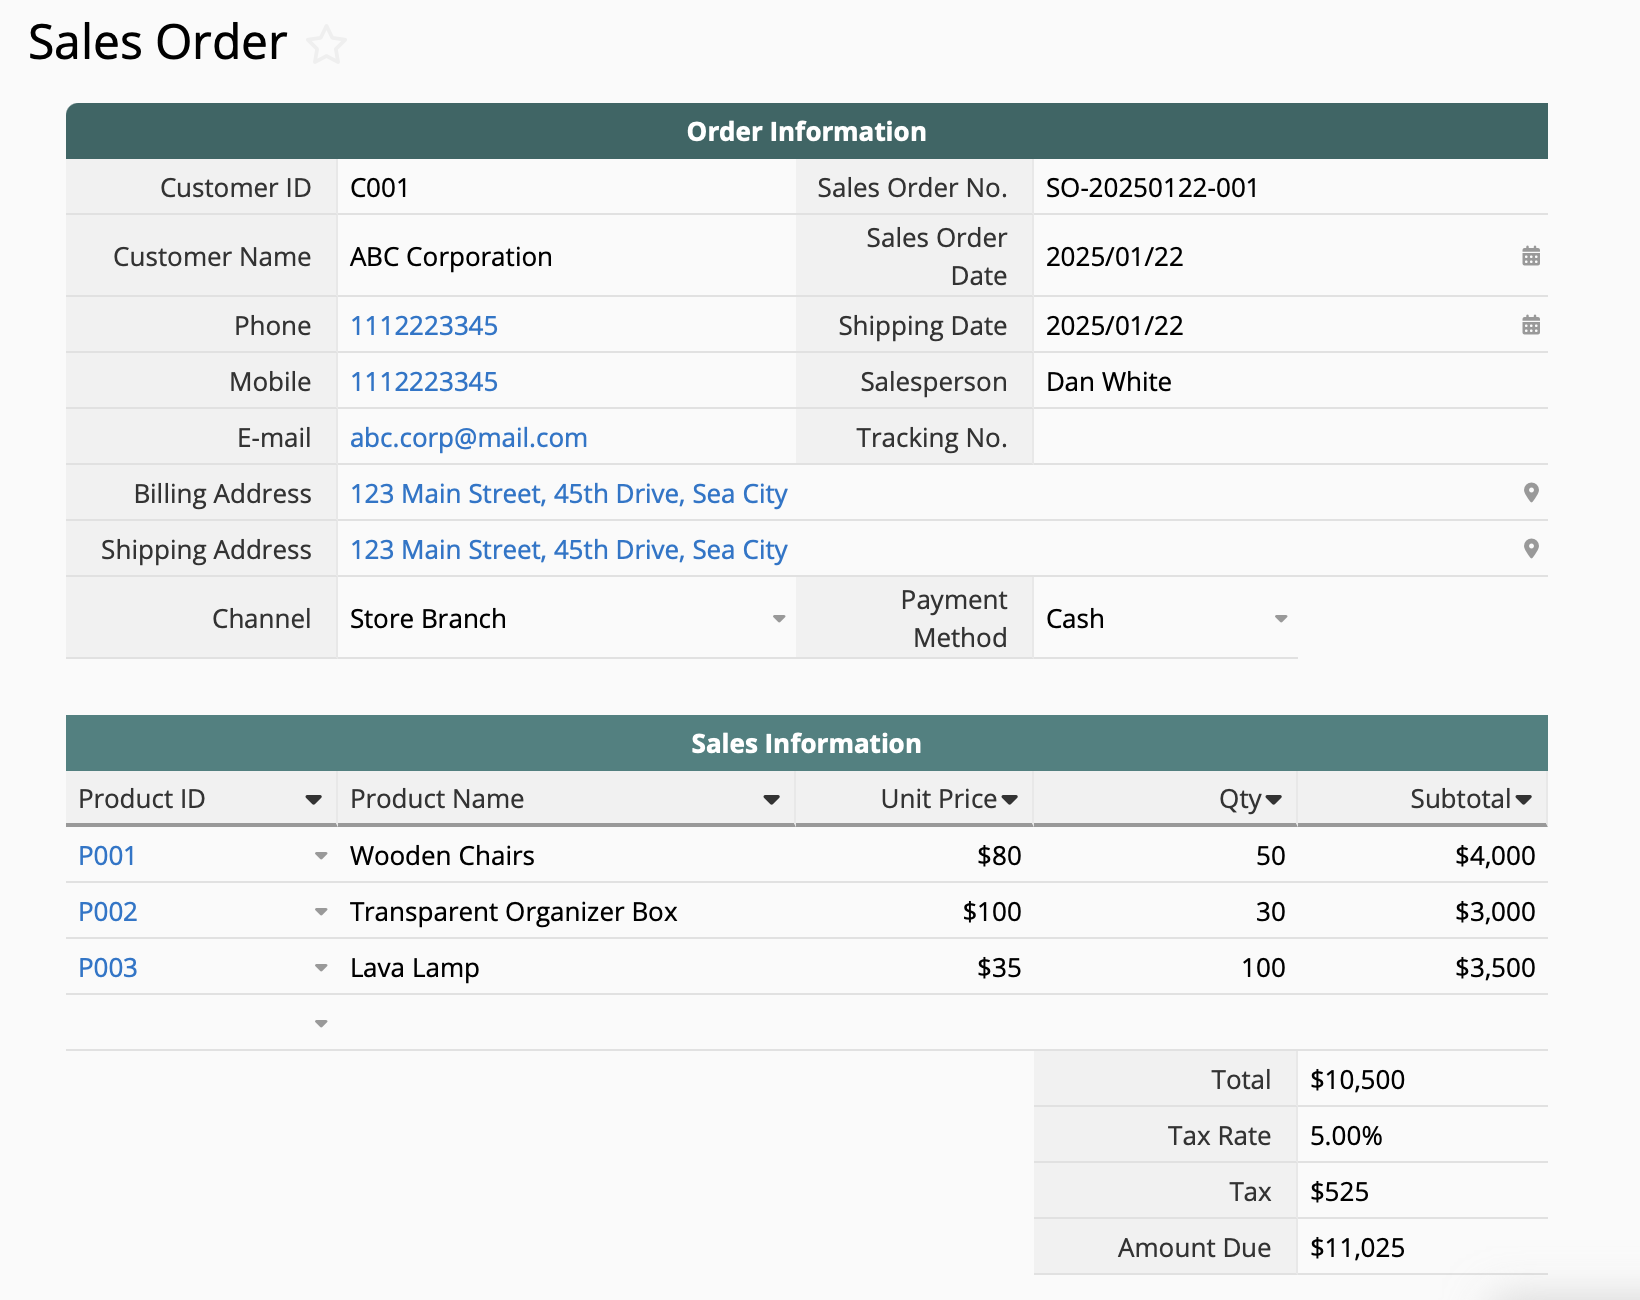
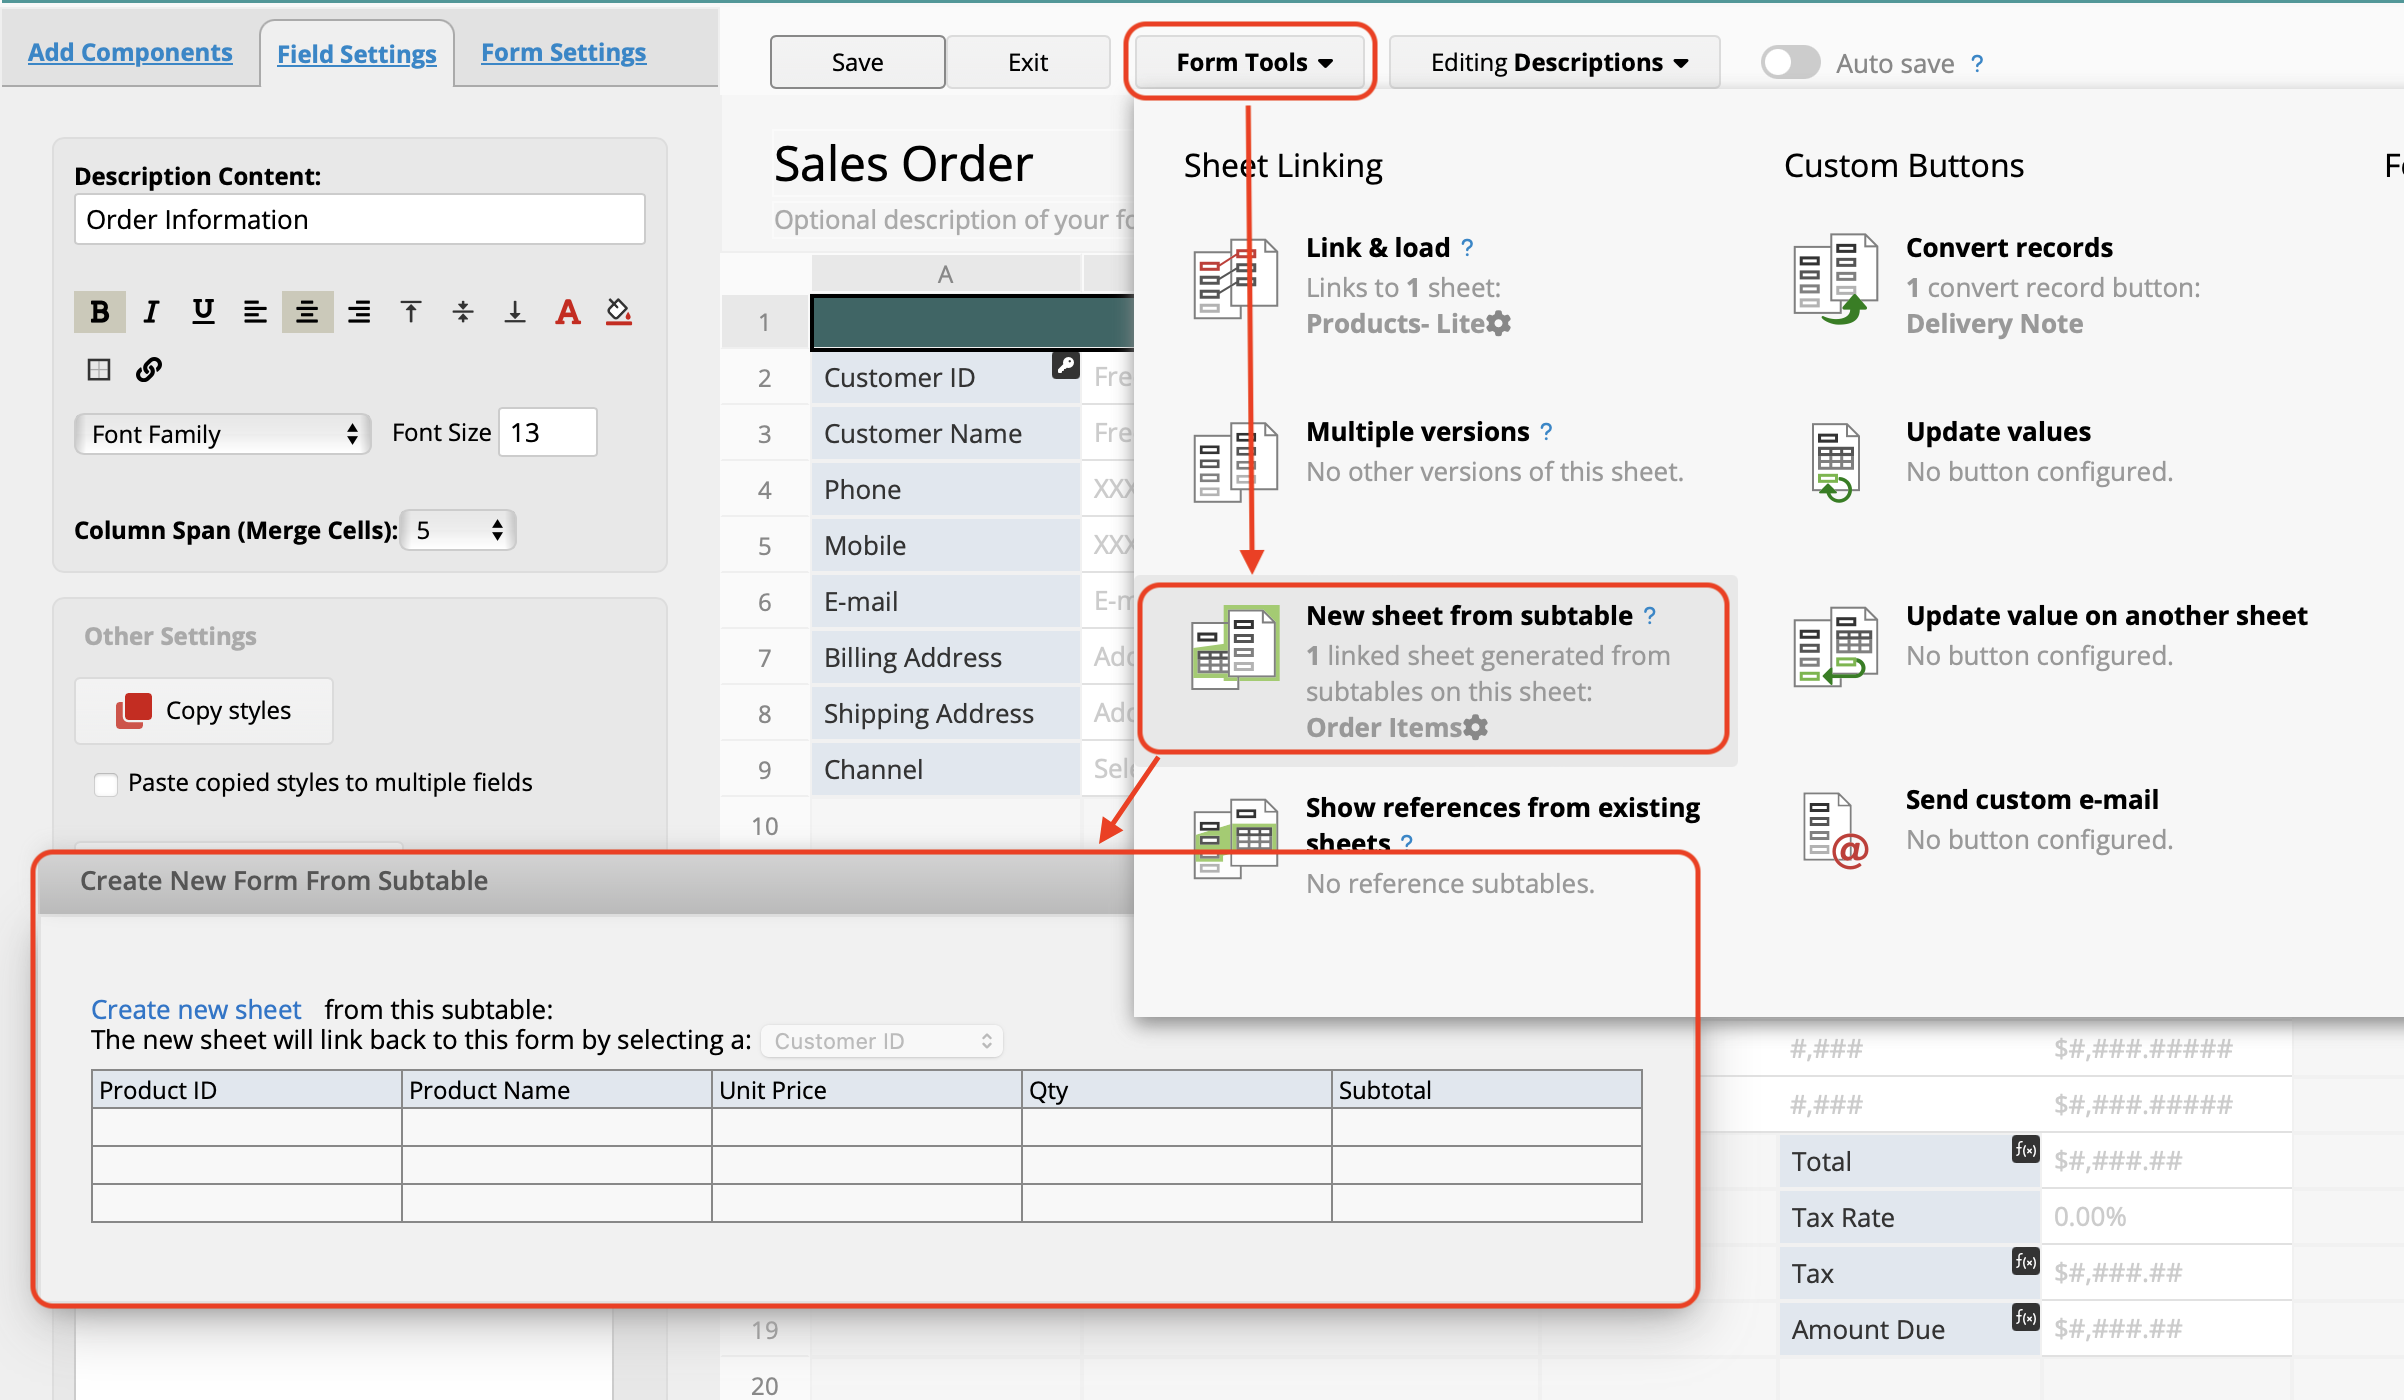
We use a subtable to record the order items in the Sales Order sheet. Since subtables are actually "multiple records within one record," these fields cannot be exported directly. You can then enter Design Mode and choose to create a new sheet from subtable to convert each subtable row into independent records.
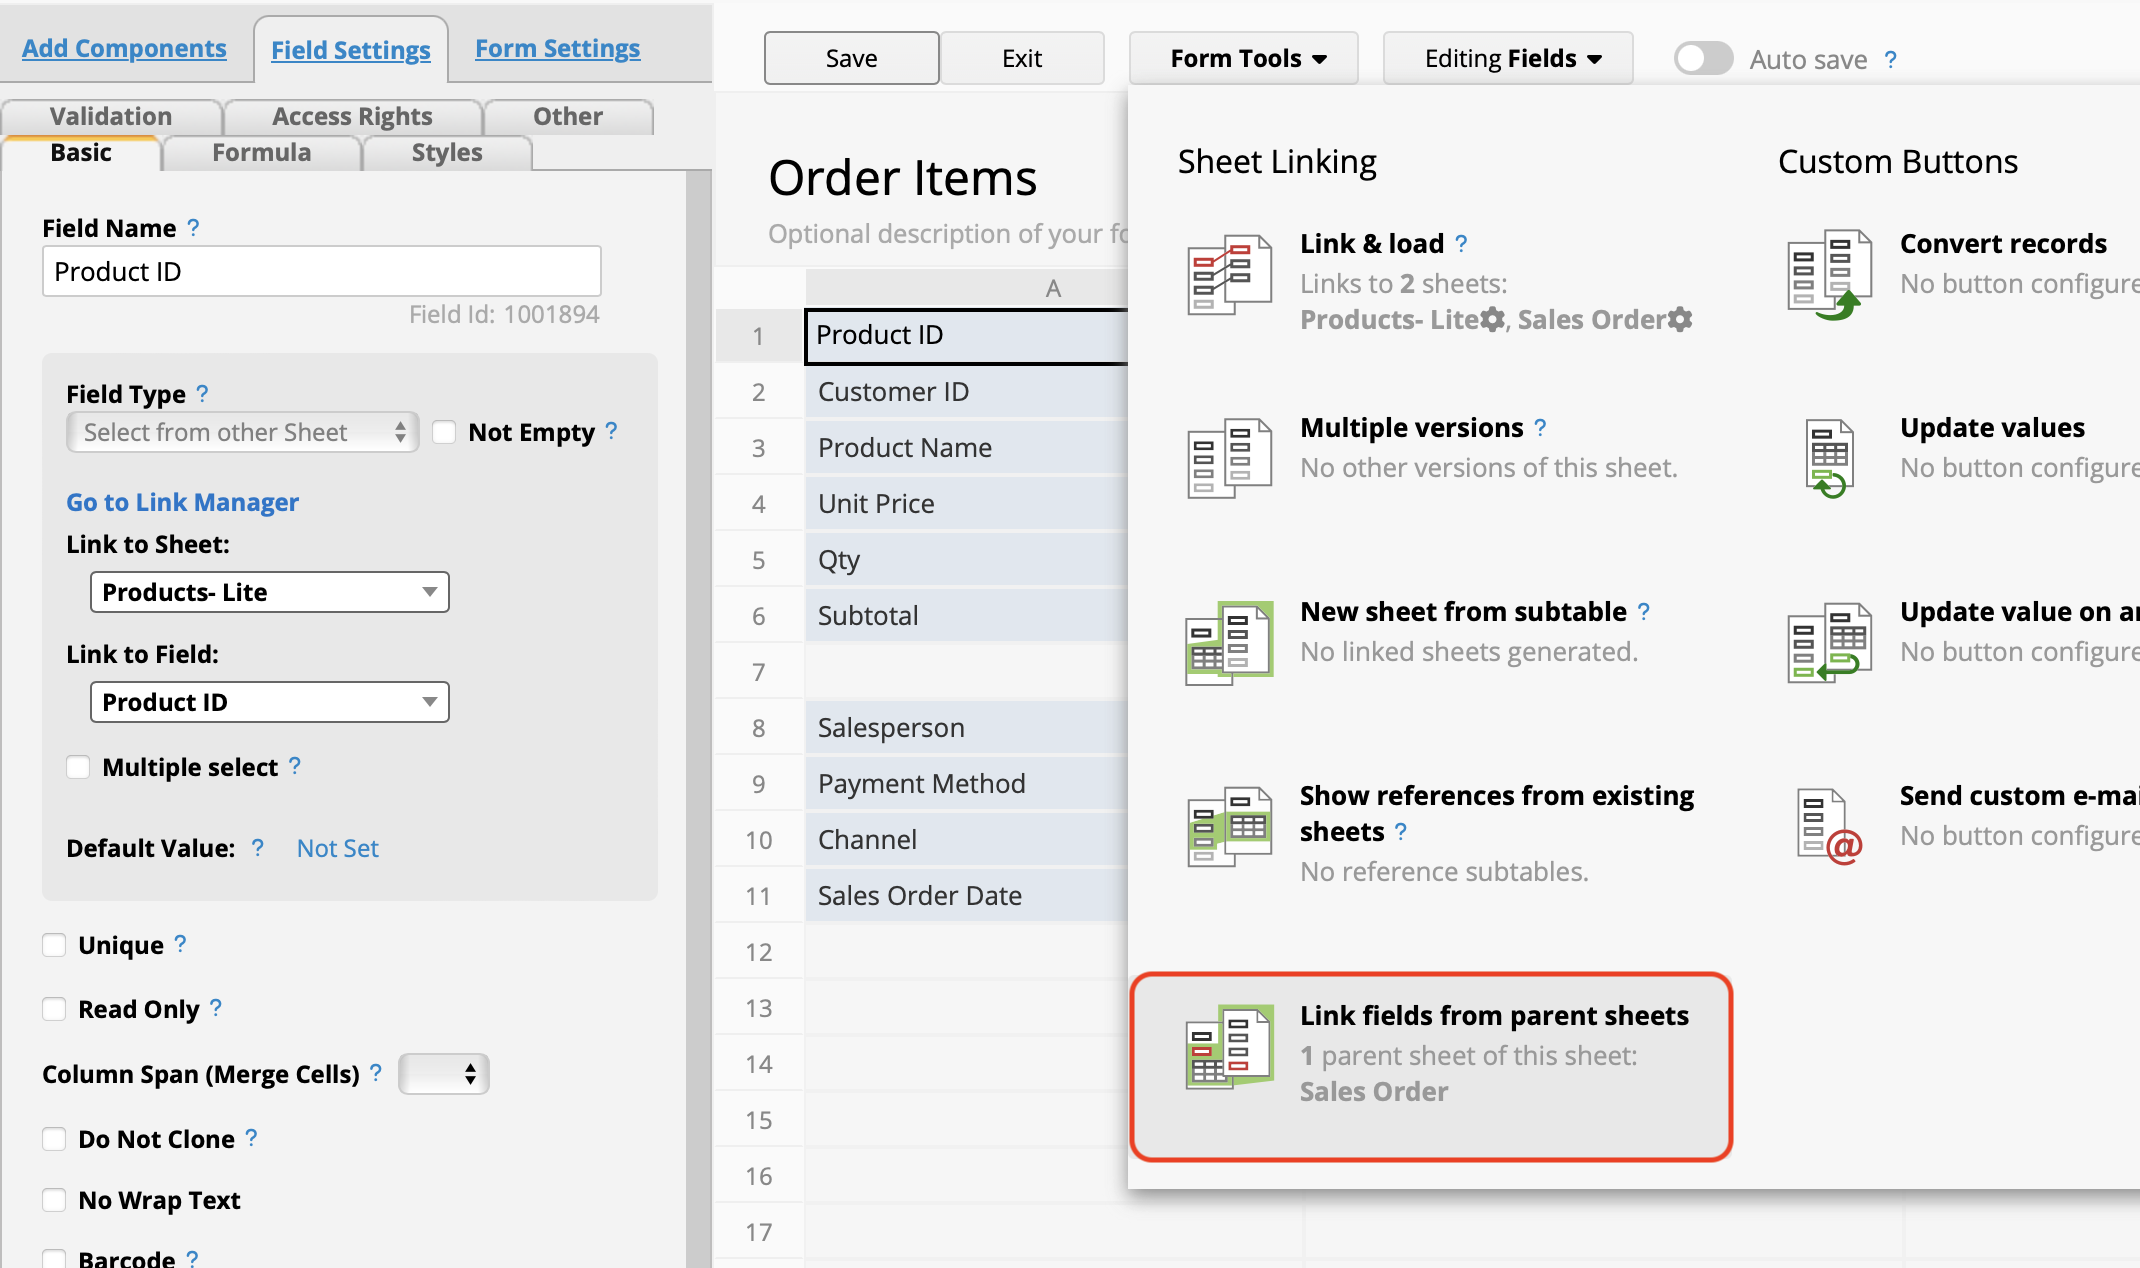
If you use the web version of Power BI, you won't be able to perform complex data settings (such as linking different sheets together). Hence, you need to link fields from the original sheet to the new sheet generated by the subtable, such as customer name, total amount, and other necessary fields. This way, you'll be able to make charts and perform analysis using the data in a single sheet (single file).
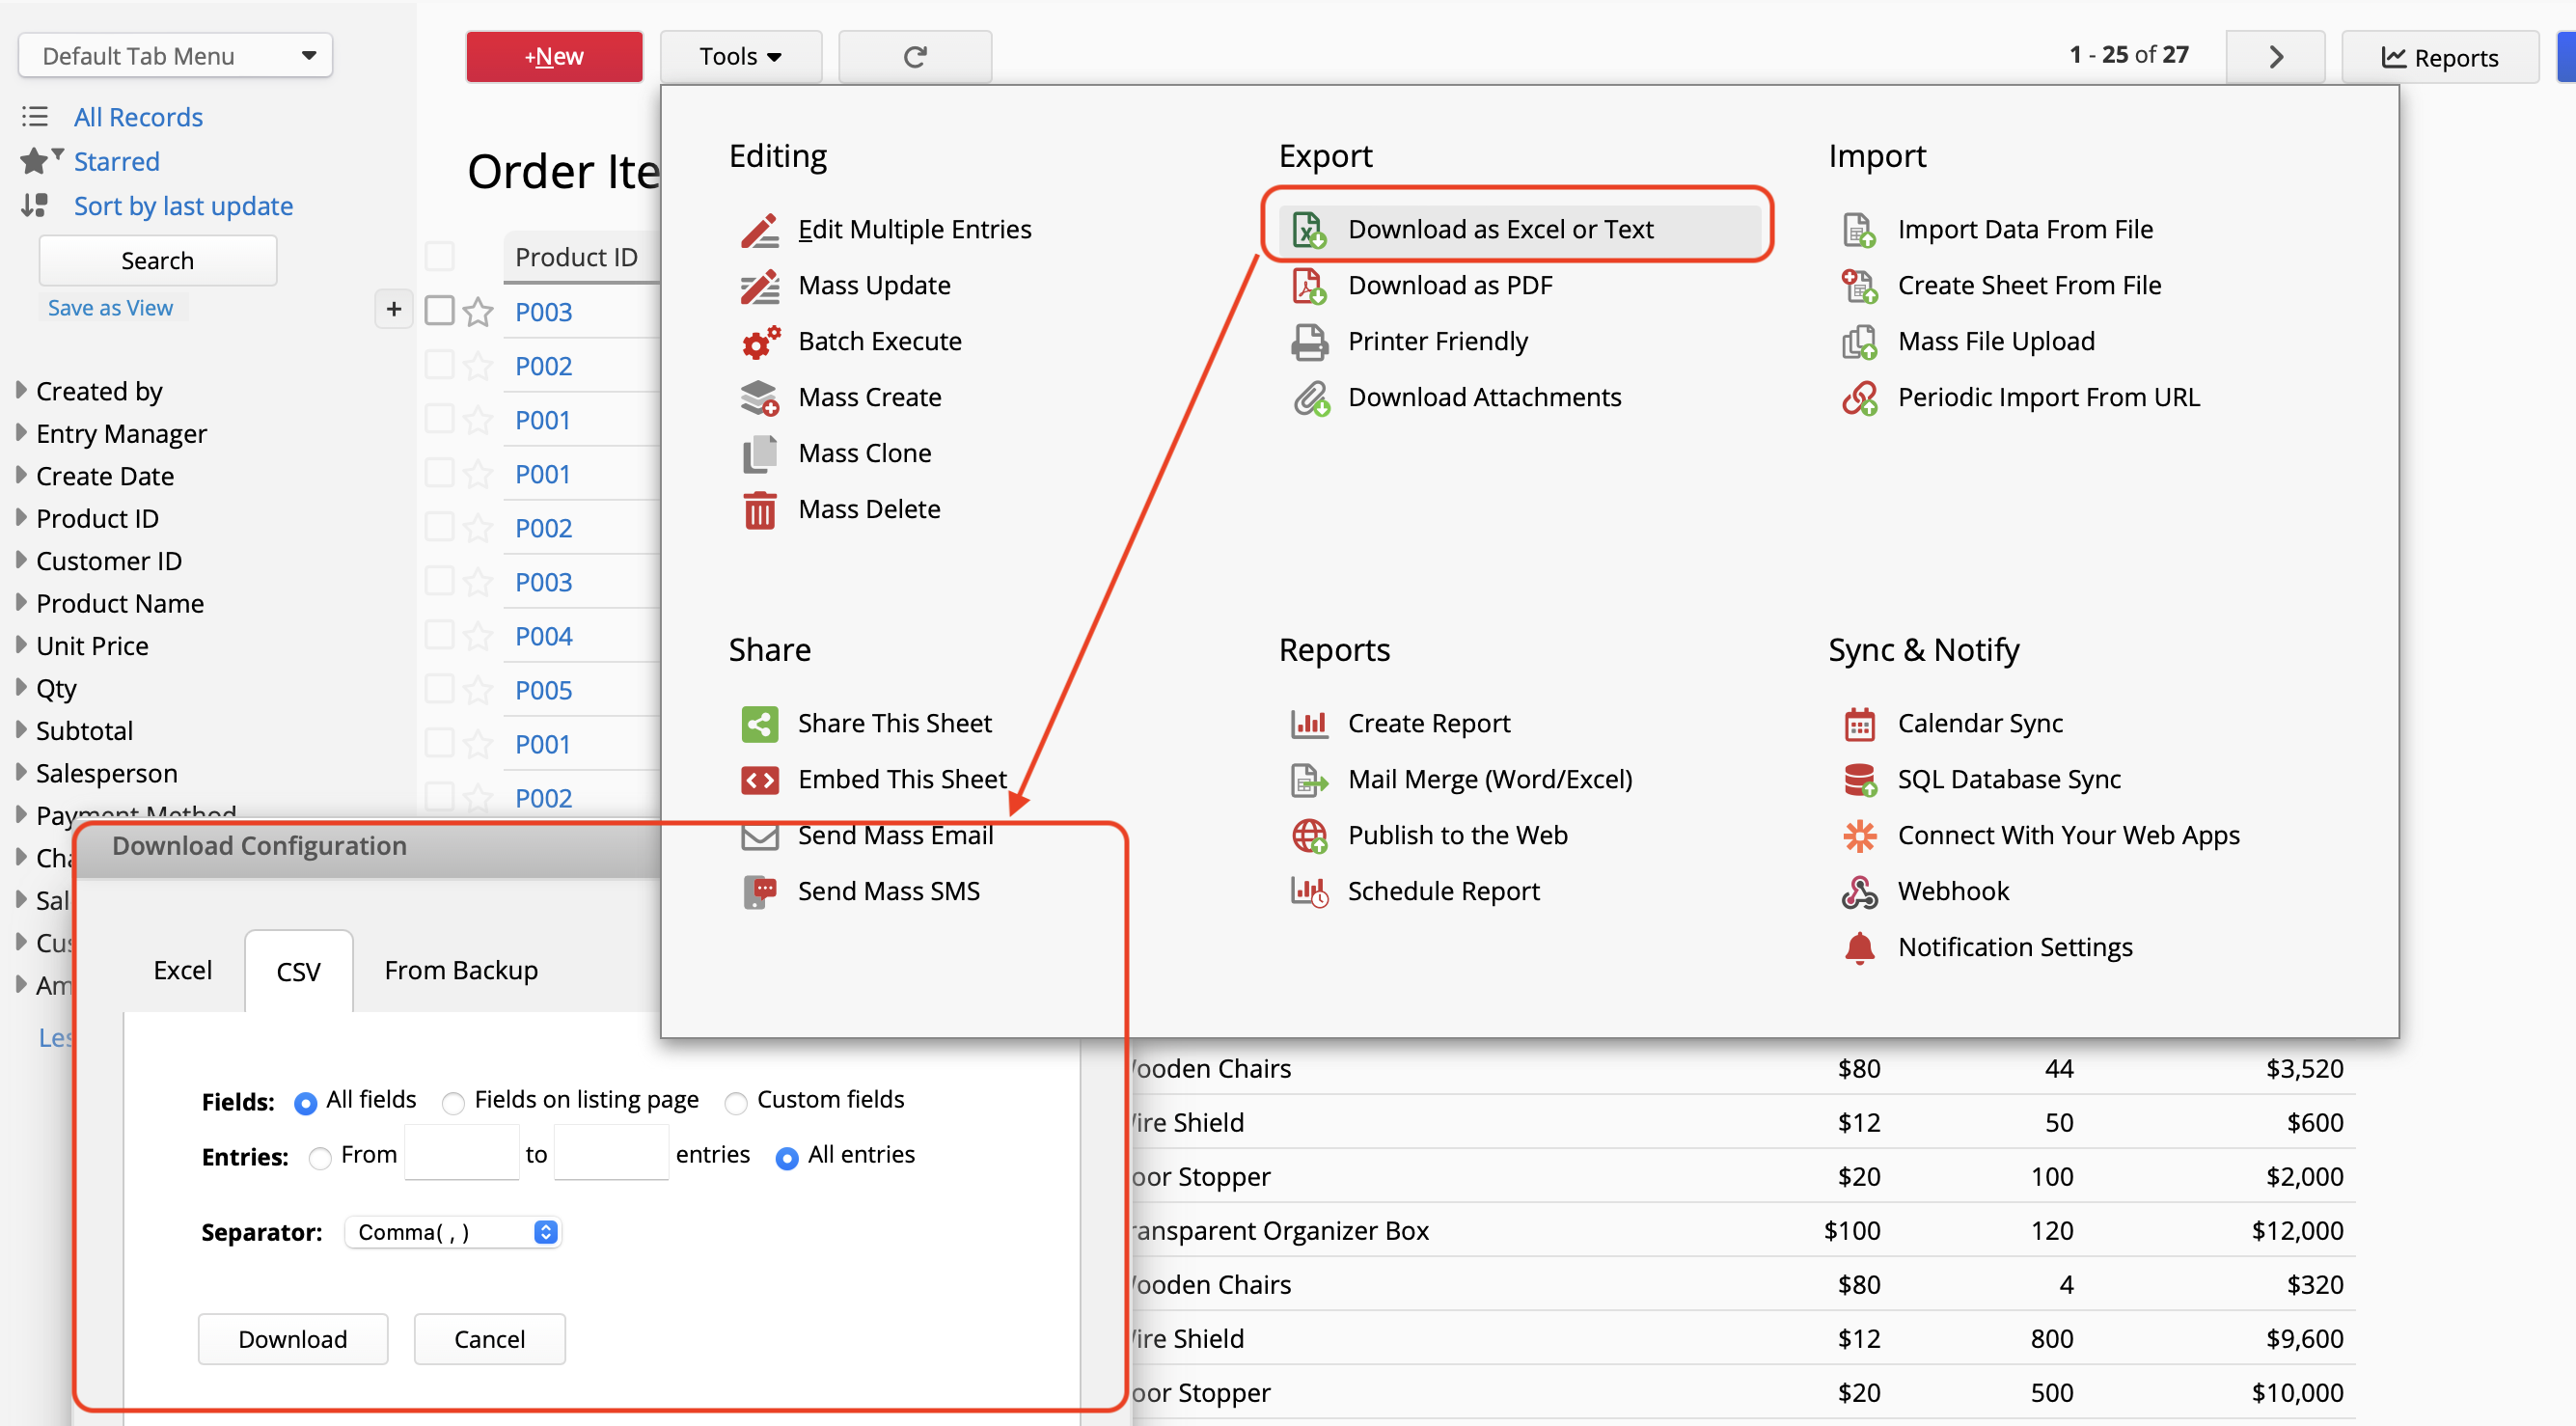
Power BI has minimal support for Excel .xlsx files and requires additional steps to convert and format them into a dataset that Power BI can use (called "semantic model"). Hence, we recommend using CSV file when downloading your data. You can also adjust which fields to export, the number of records to be exported, etc. in the download configuration settings.
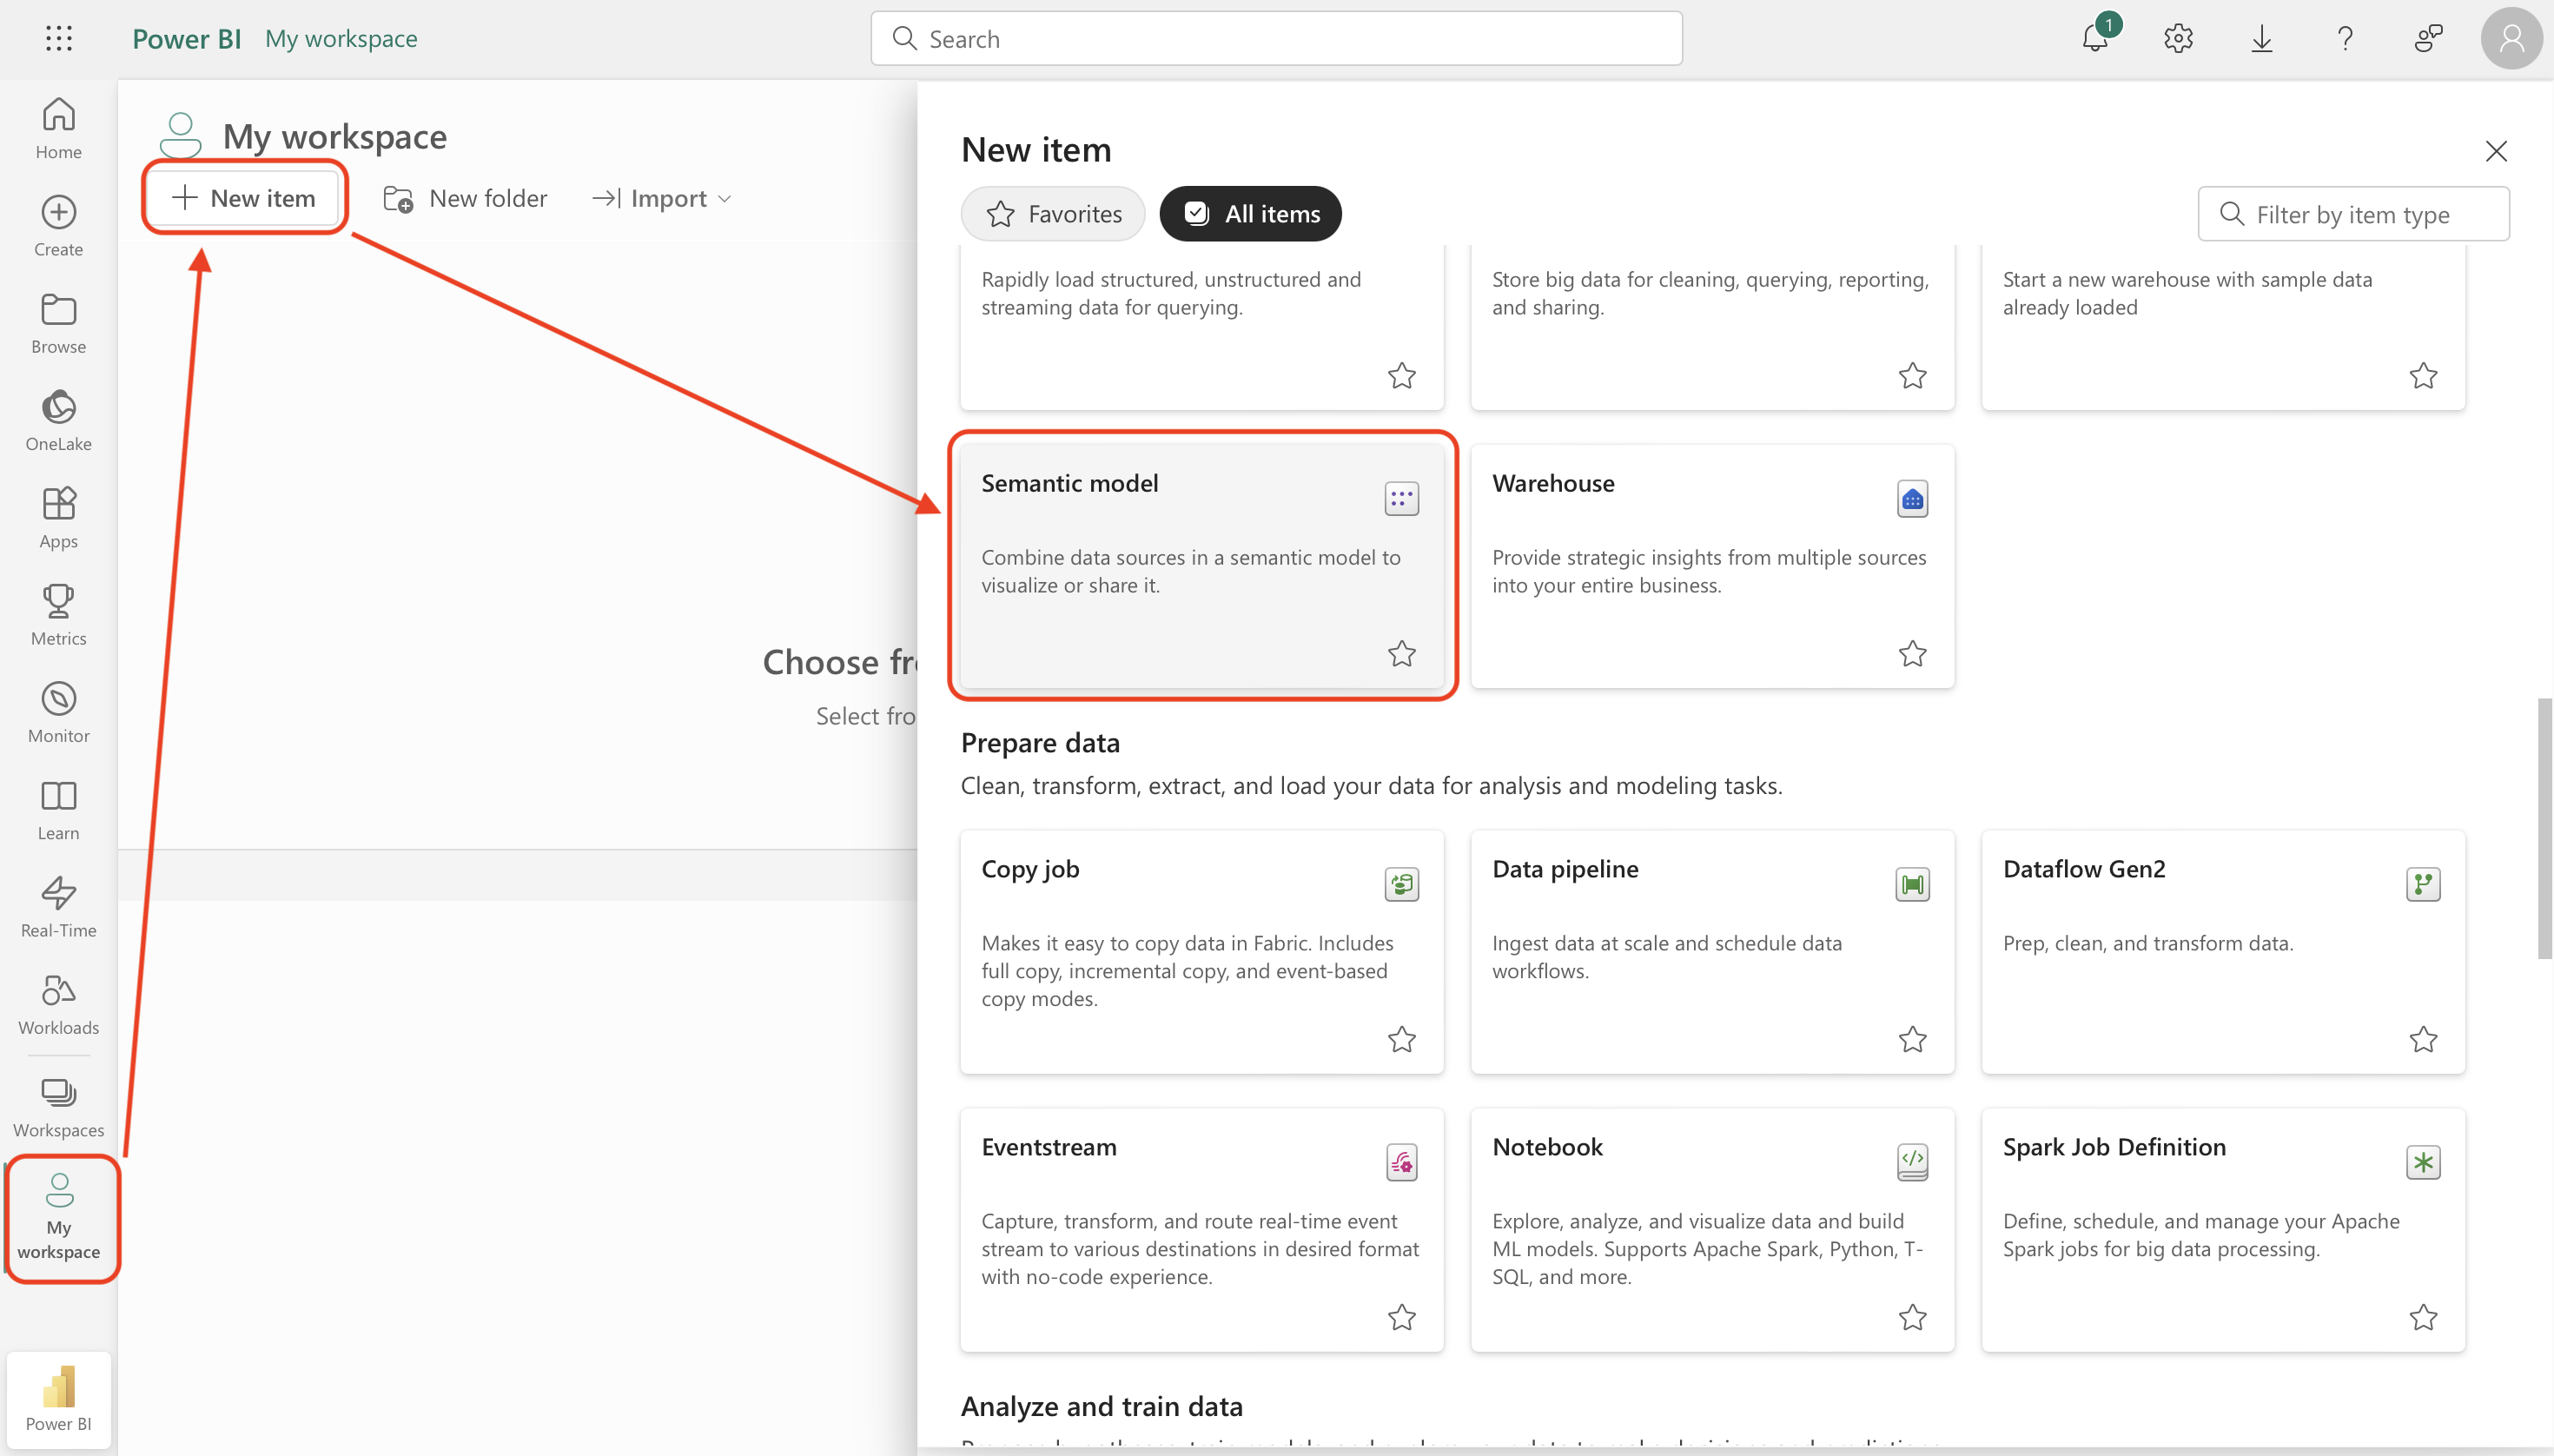
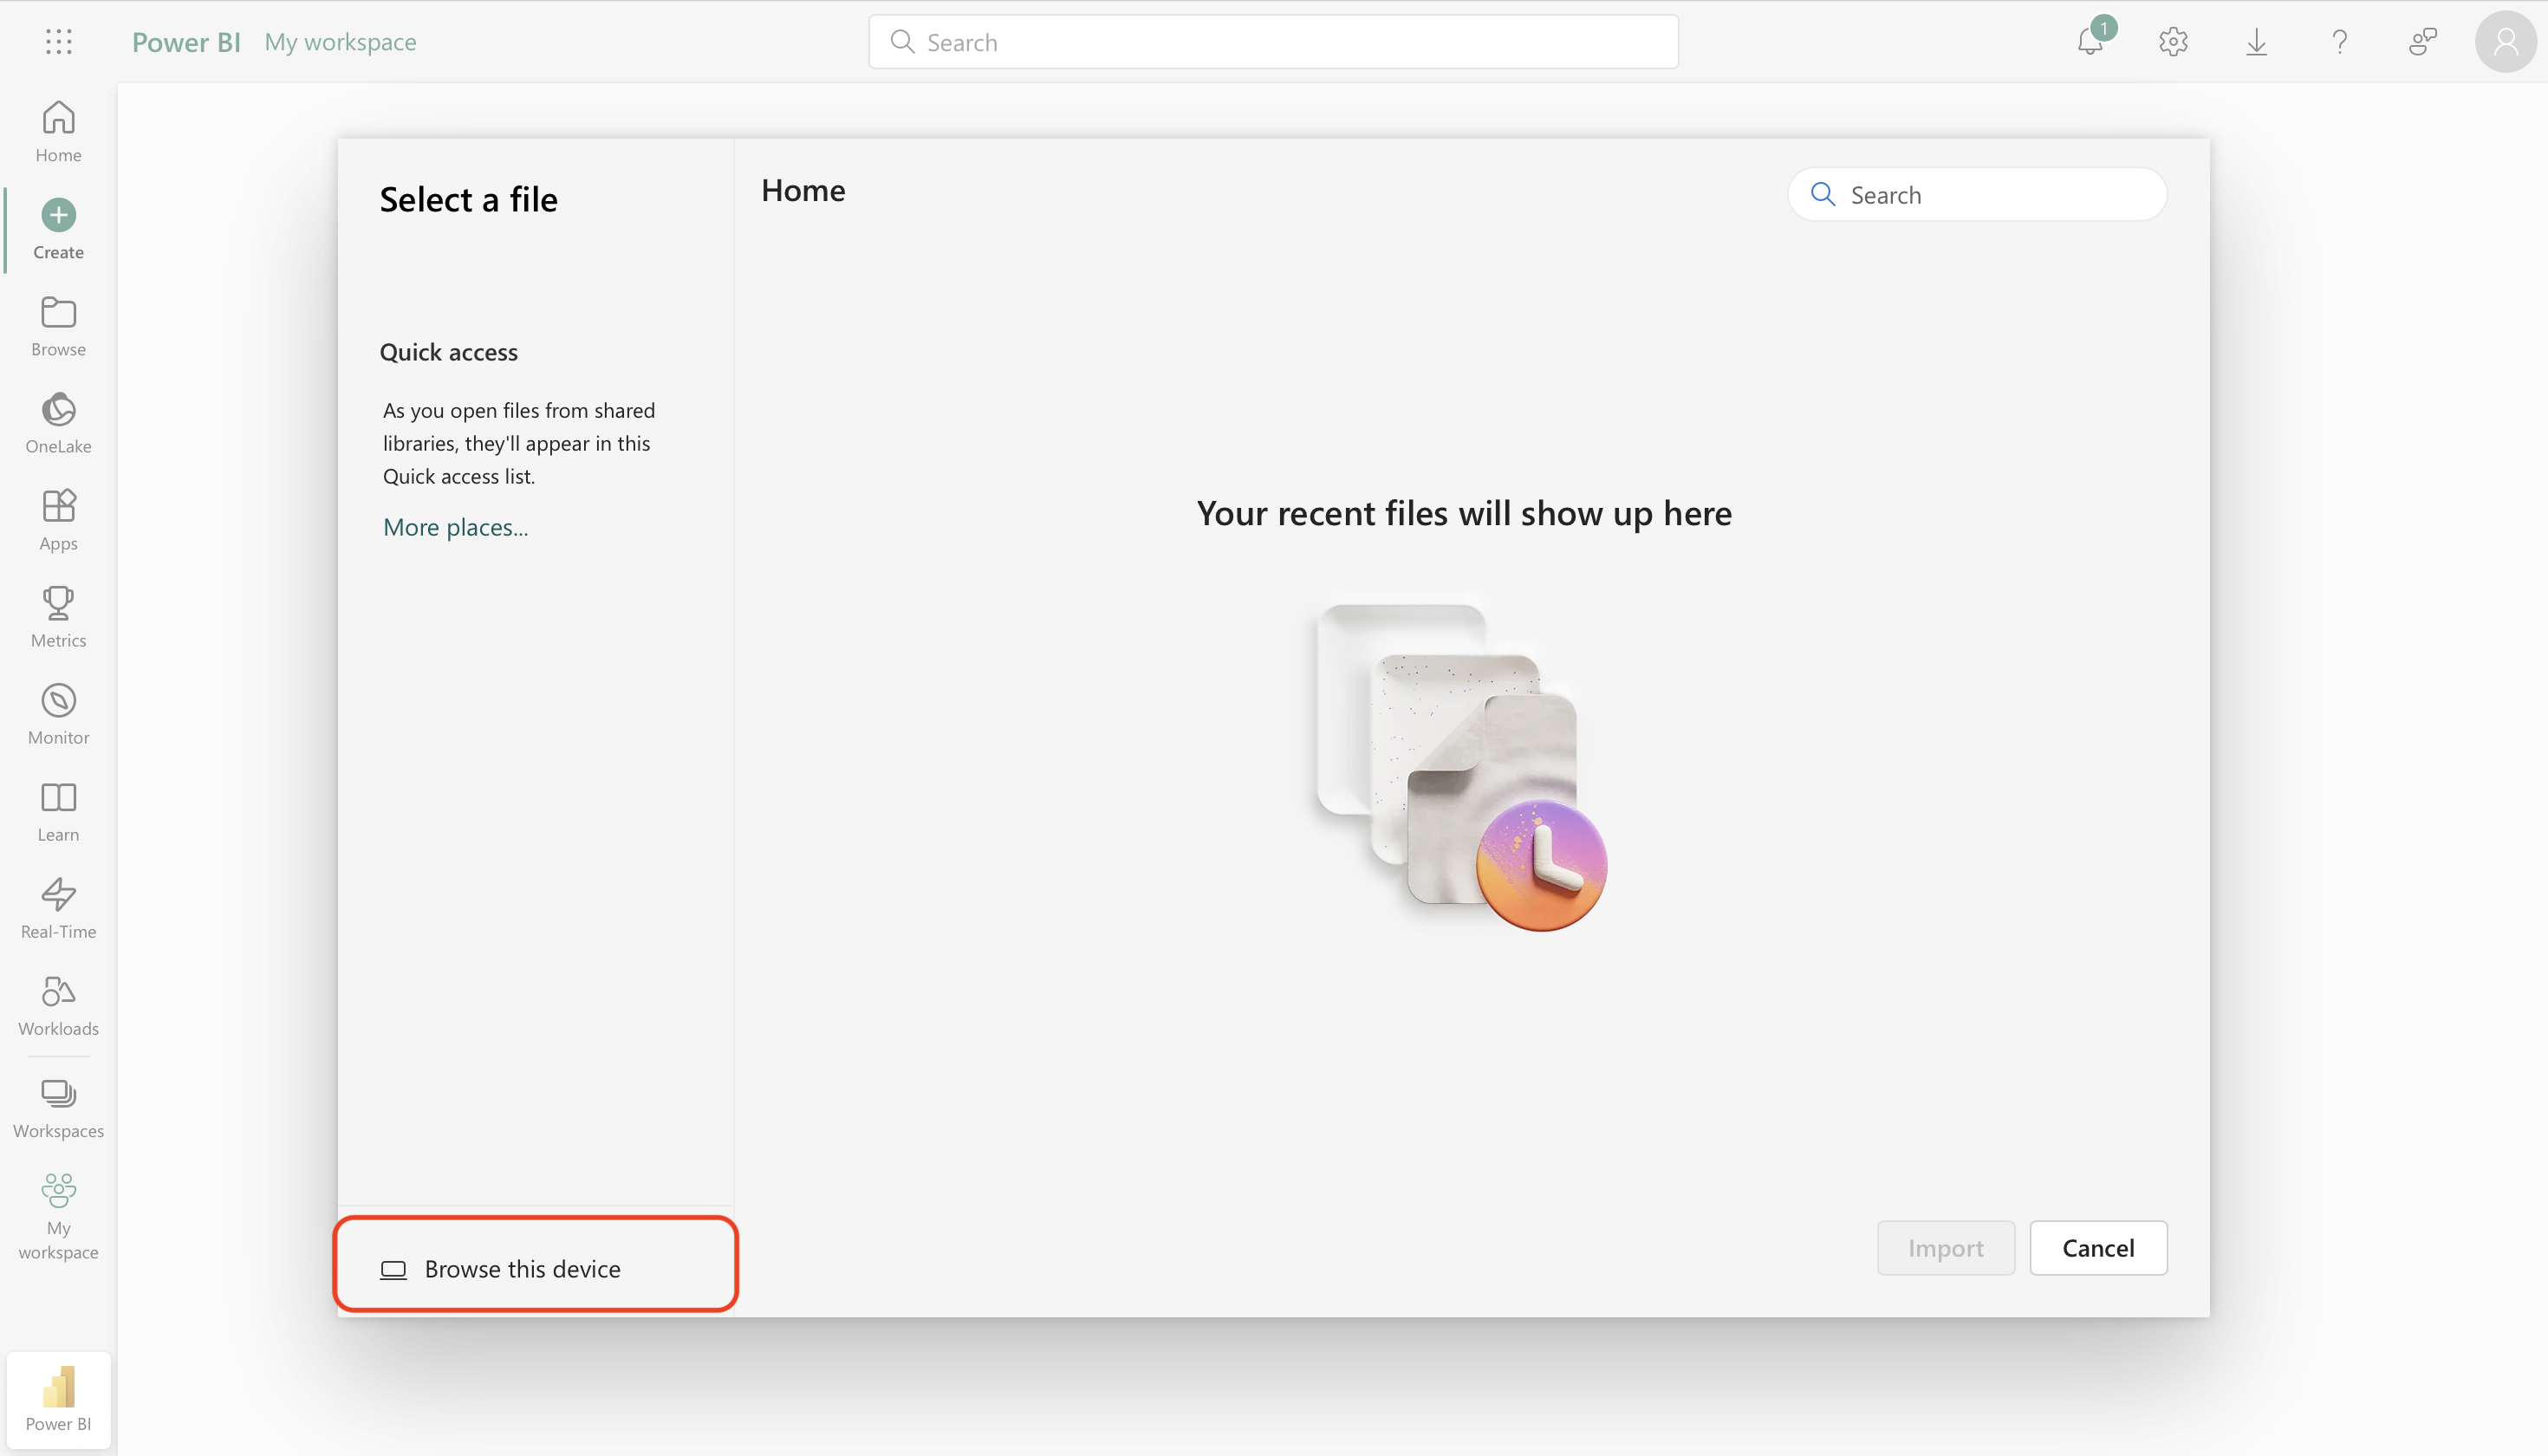
After downloading the data, you can go to "My Workspace" in Power BI Service, select "New Item → Semantic Model", select CSV and click "Browse this device" to open the window and upload the data you just downloaded.
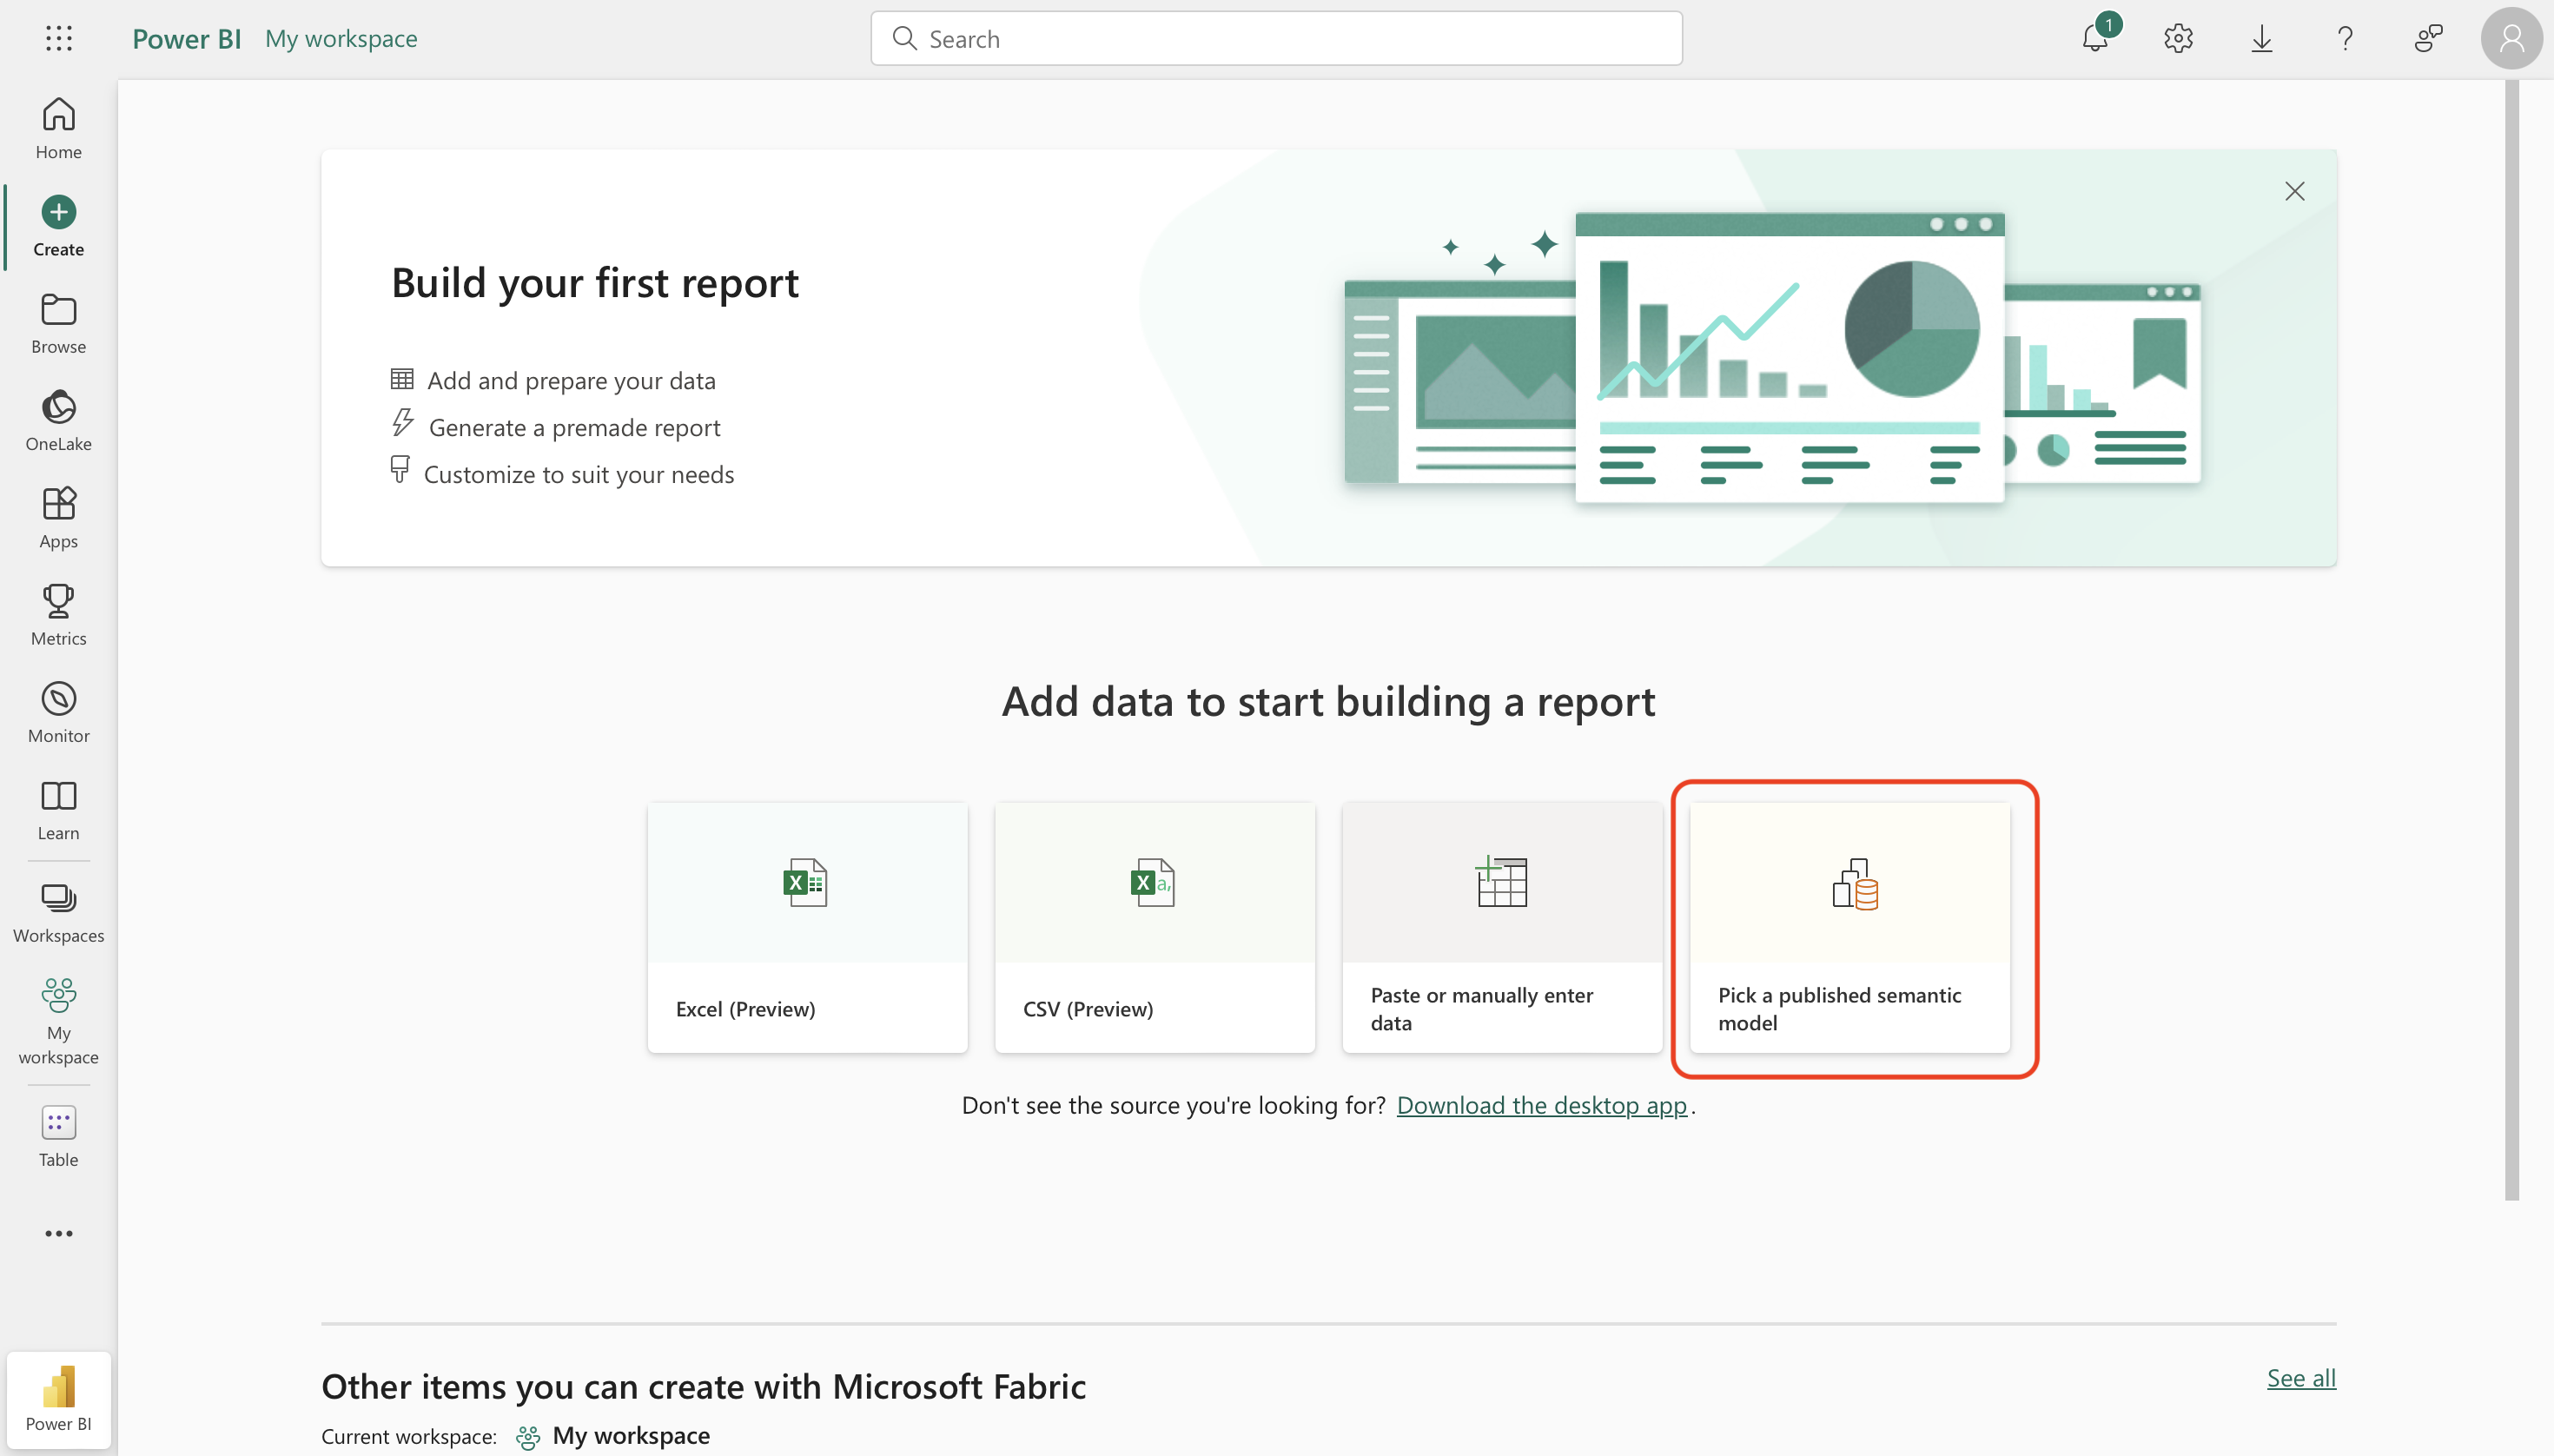
After uploading, switch to the "Create" tab and select "Pick a published semantic model" to start using this data to create your dashboard.
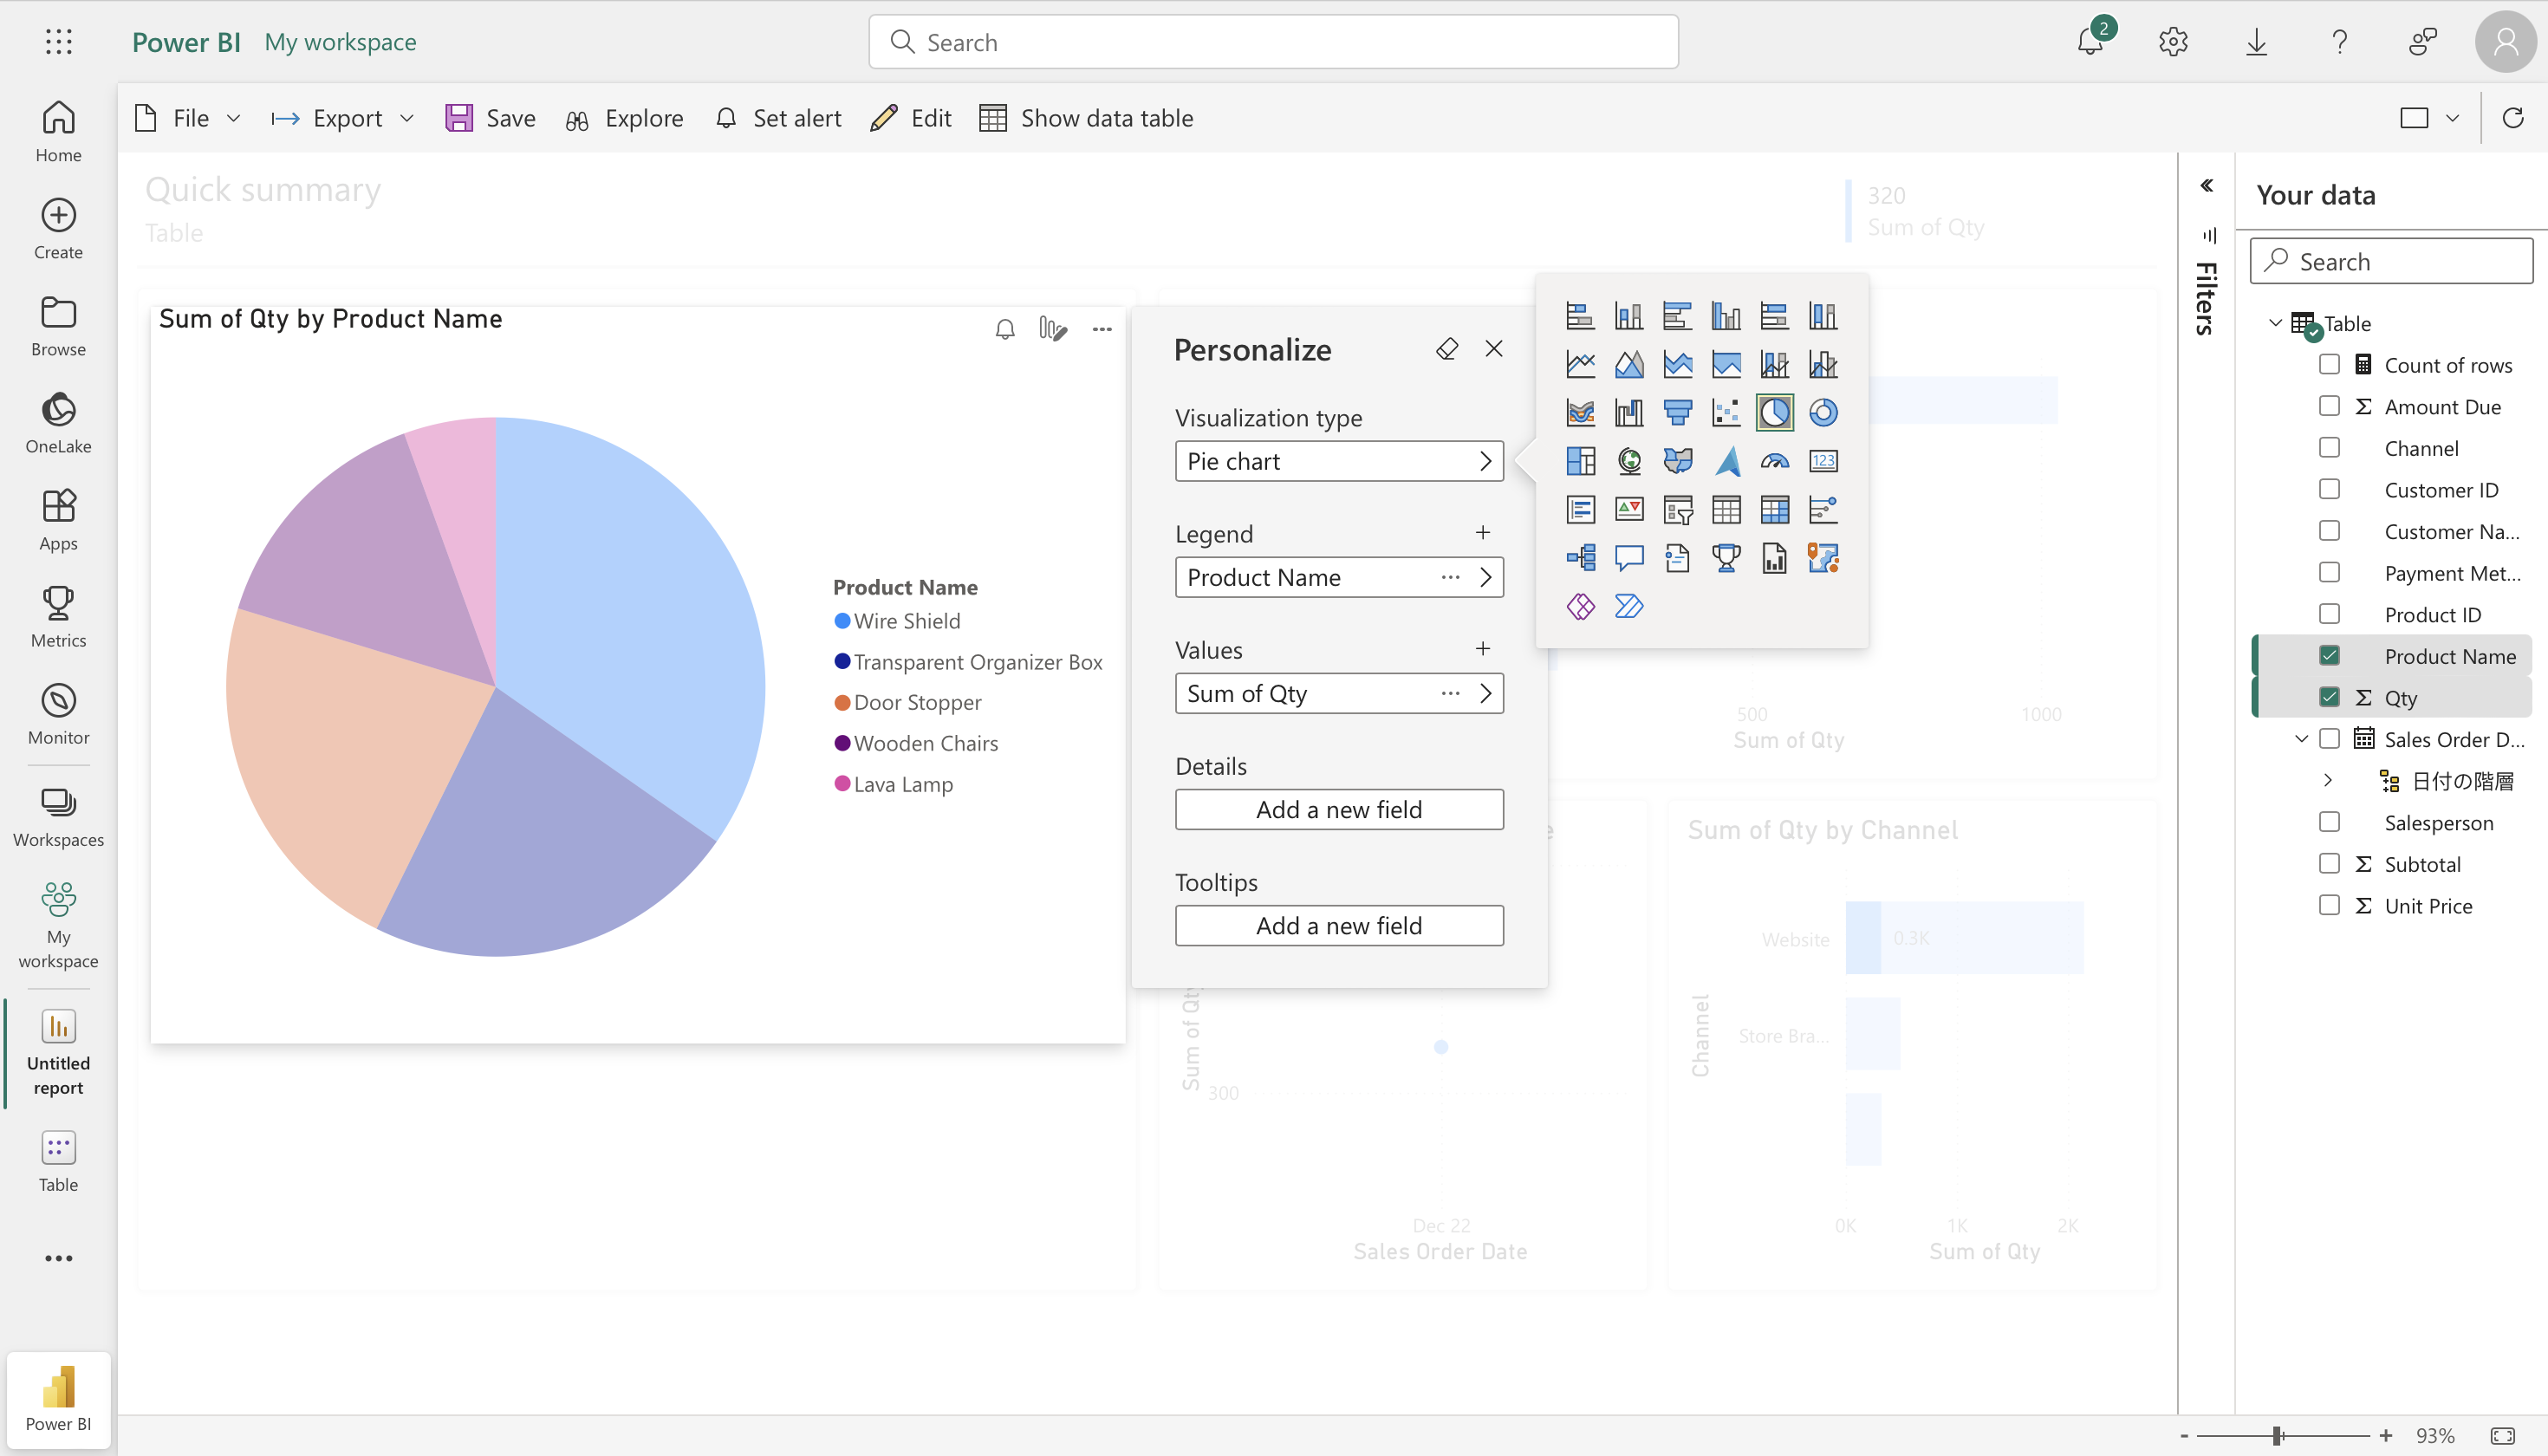
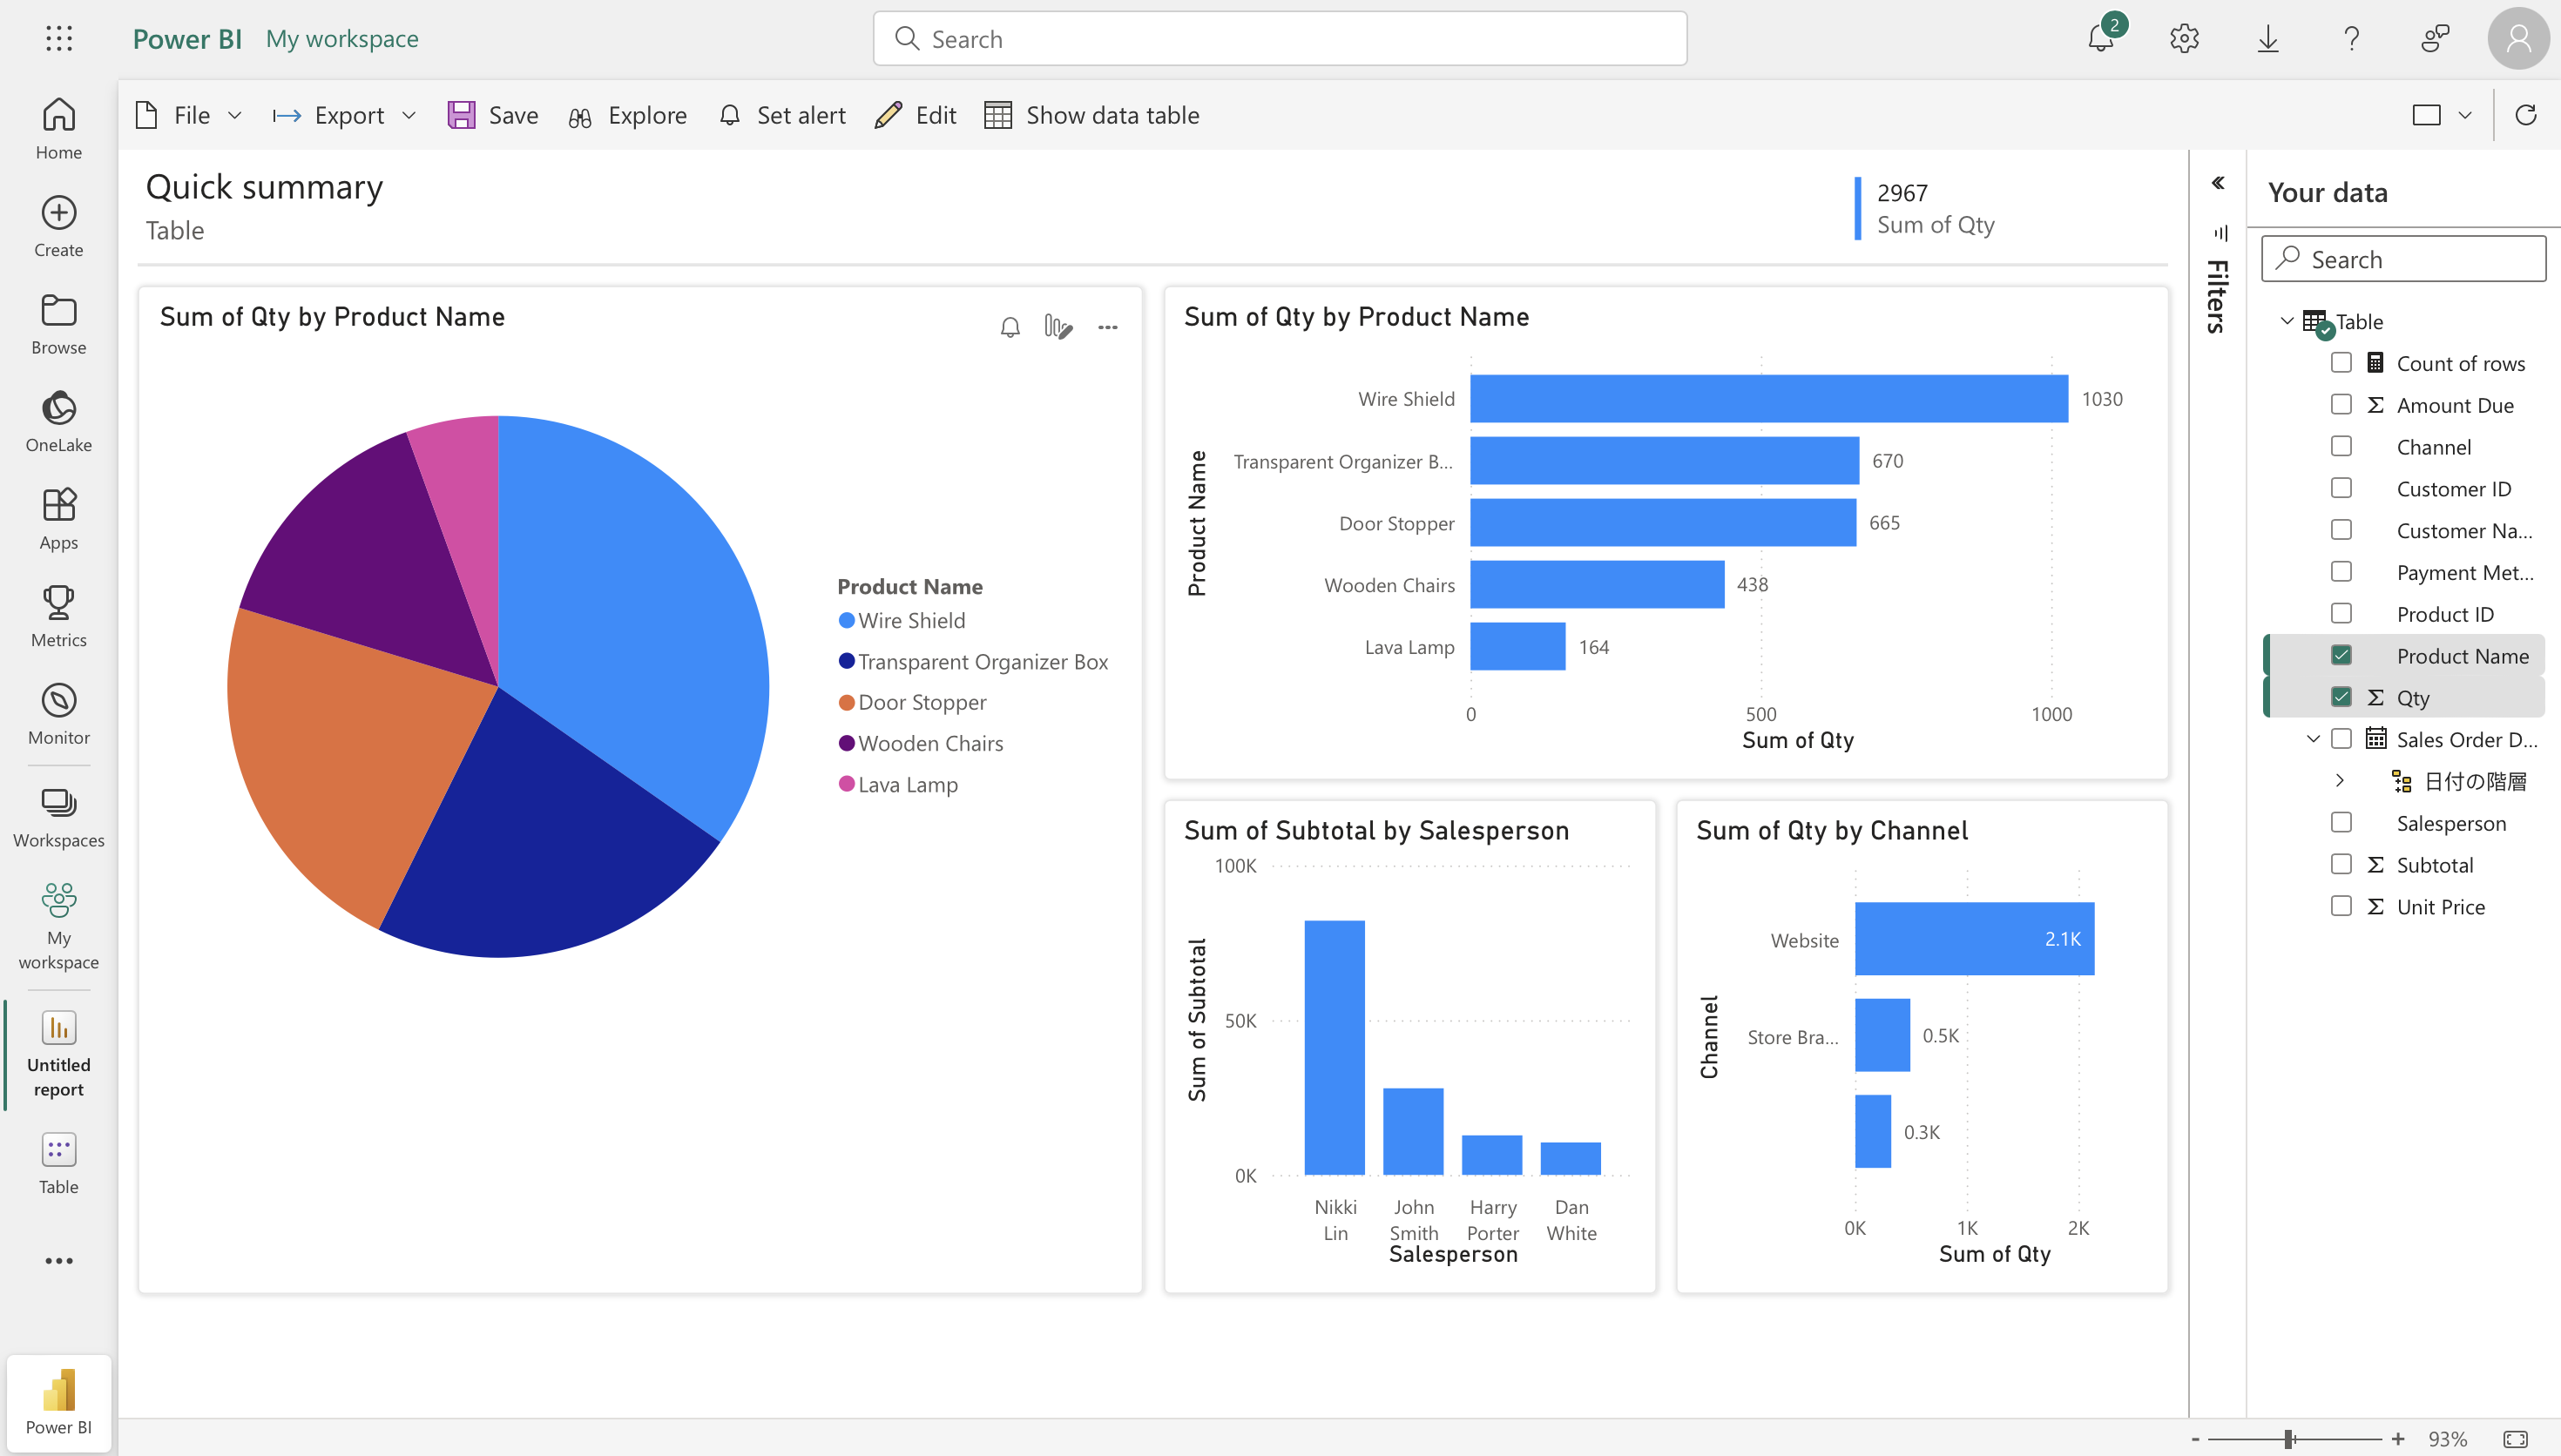
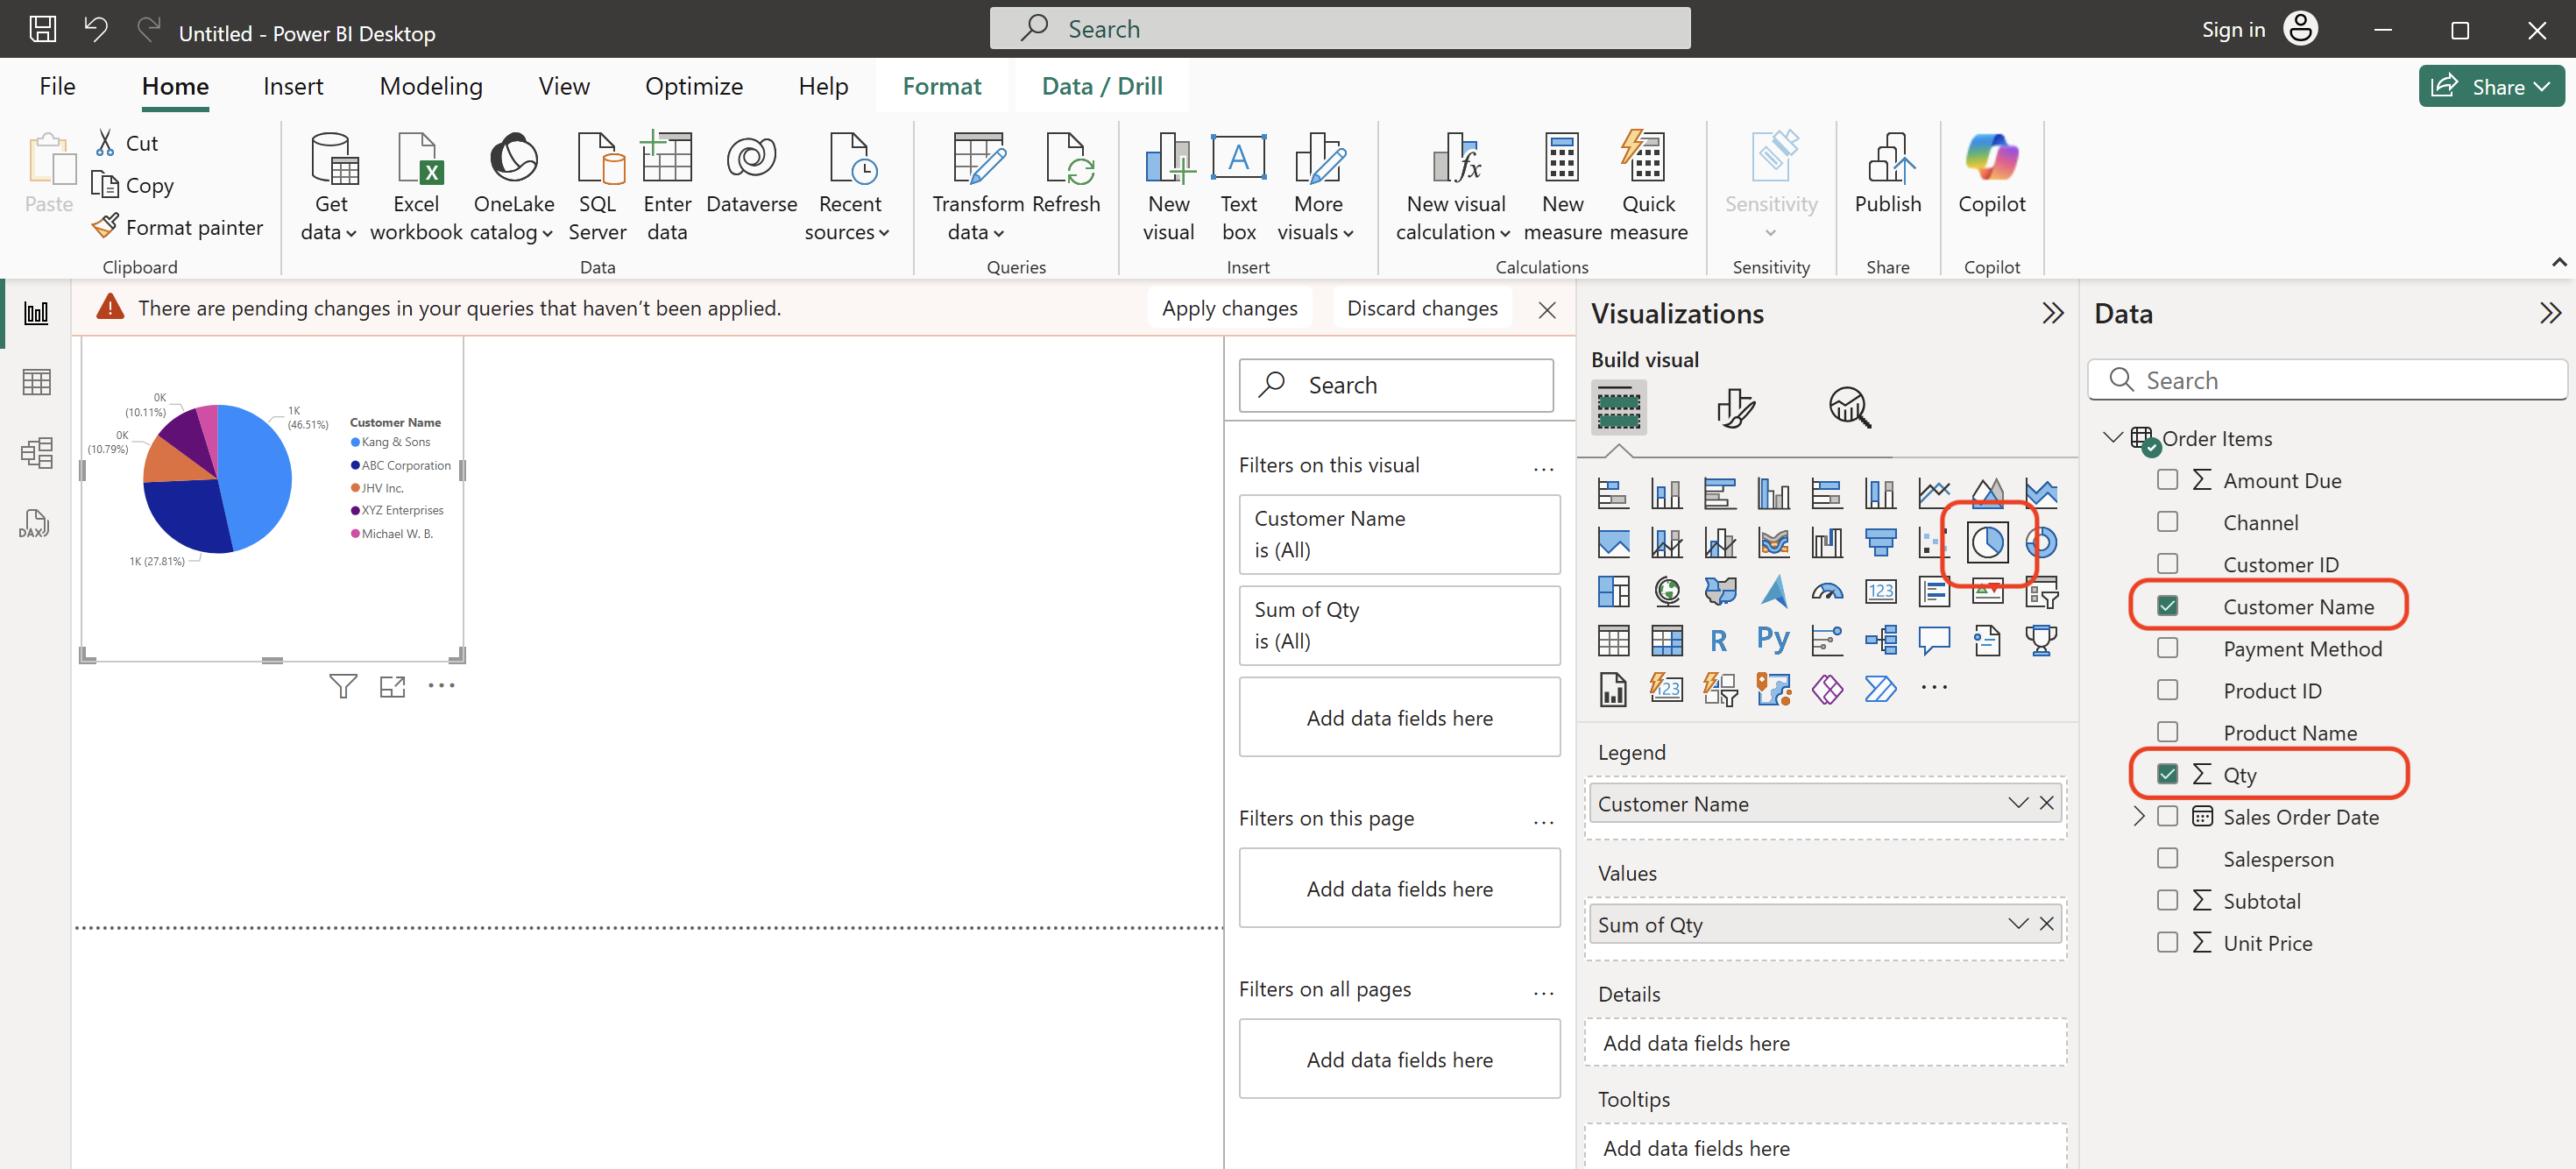
You can select the required chart type, tick the columns you would like to analyze, and generate a chart for analysis:
You can also use drag-and-drop to rearrange the chart positions and create dynamic dashboard that are easy to read:
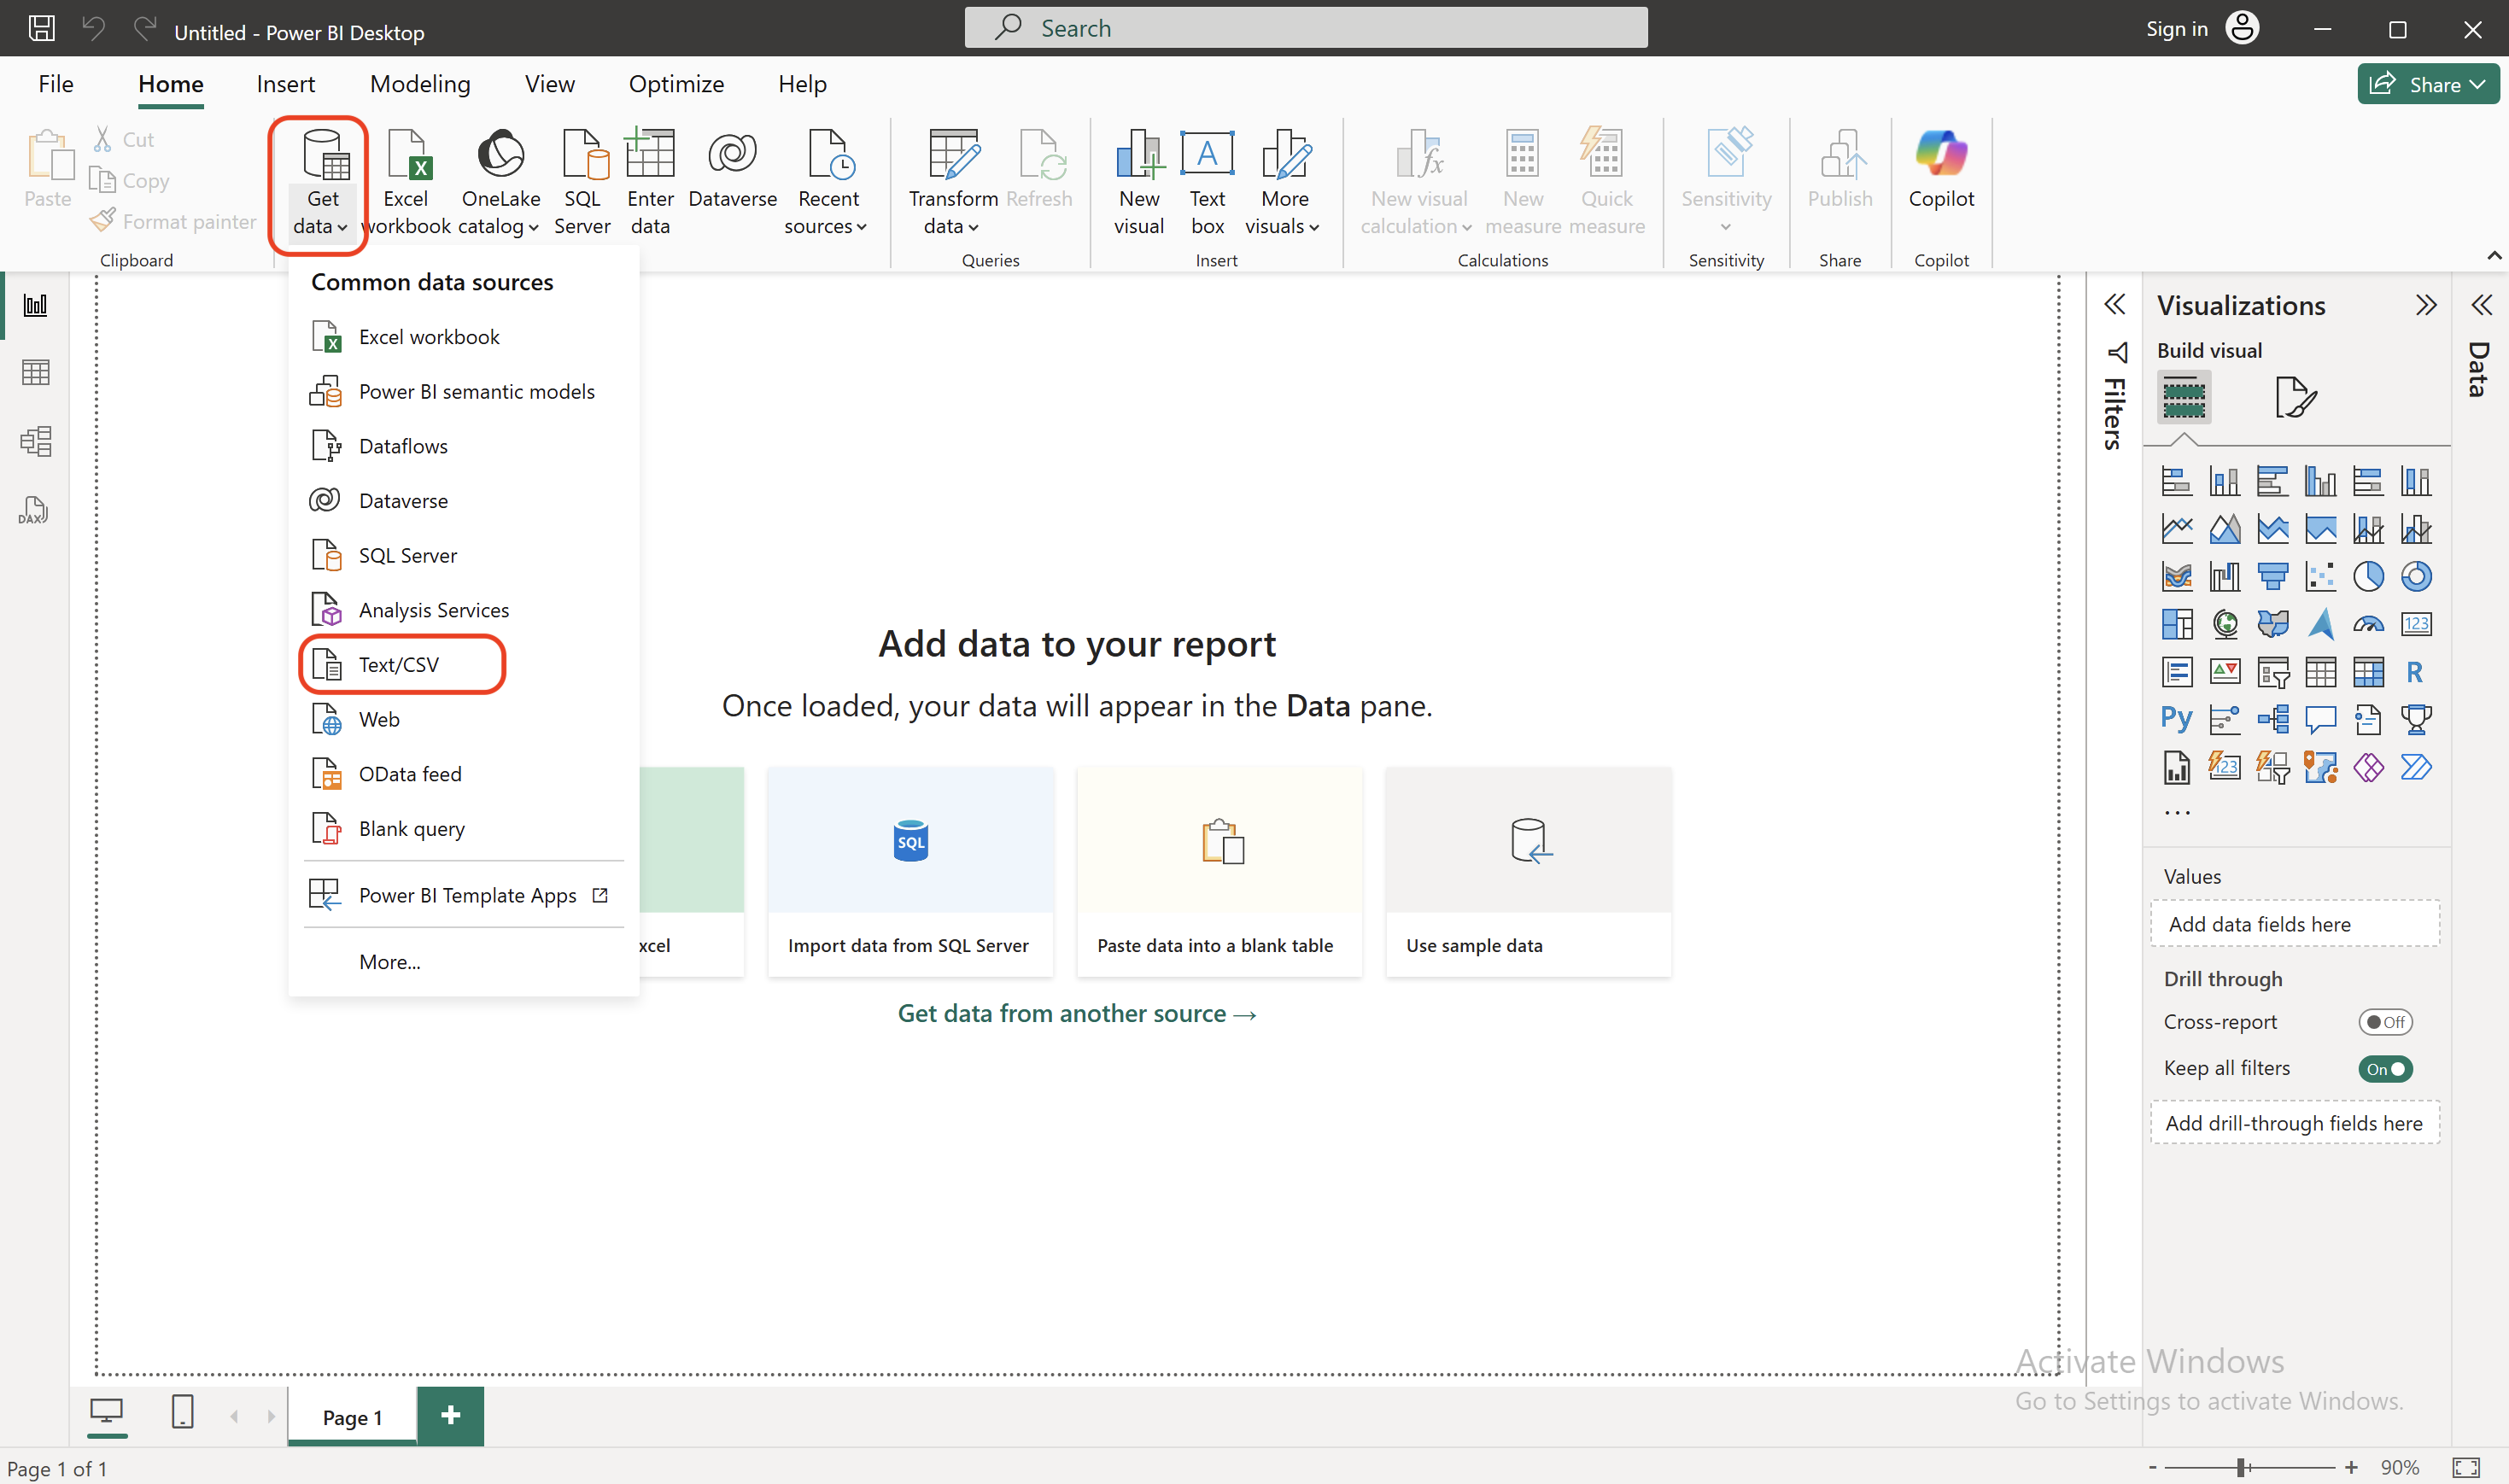
The Desktop version of Power BI has more data functions. In addition to importing CSV files, you can also link multiple CSV files or import and synchronize data through the web.
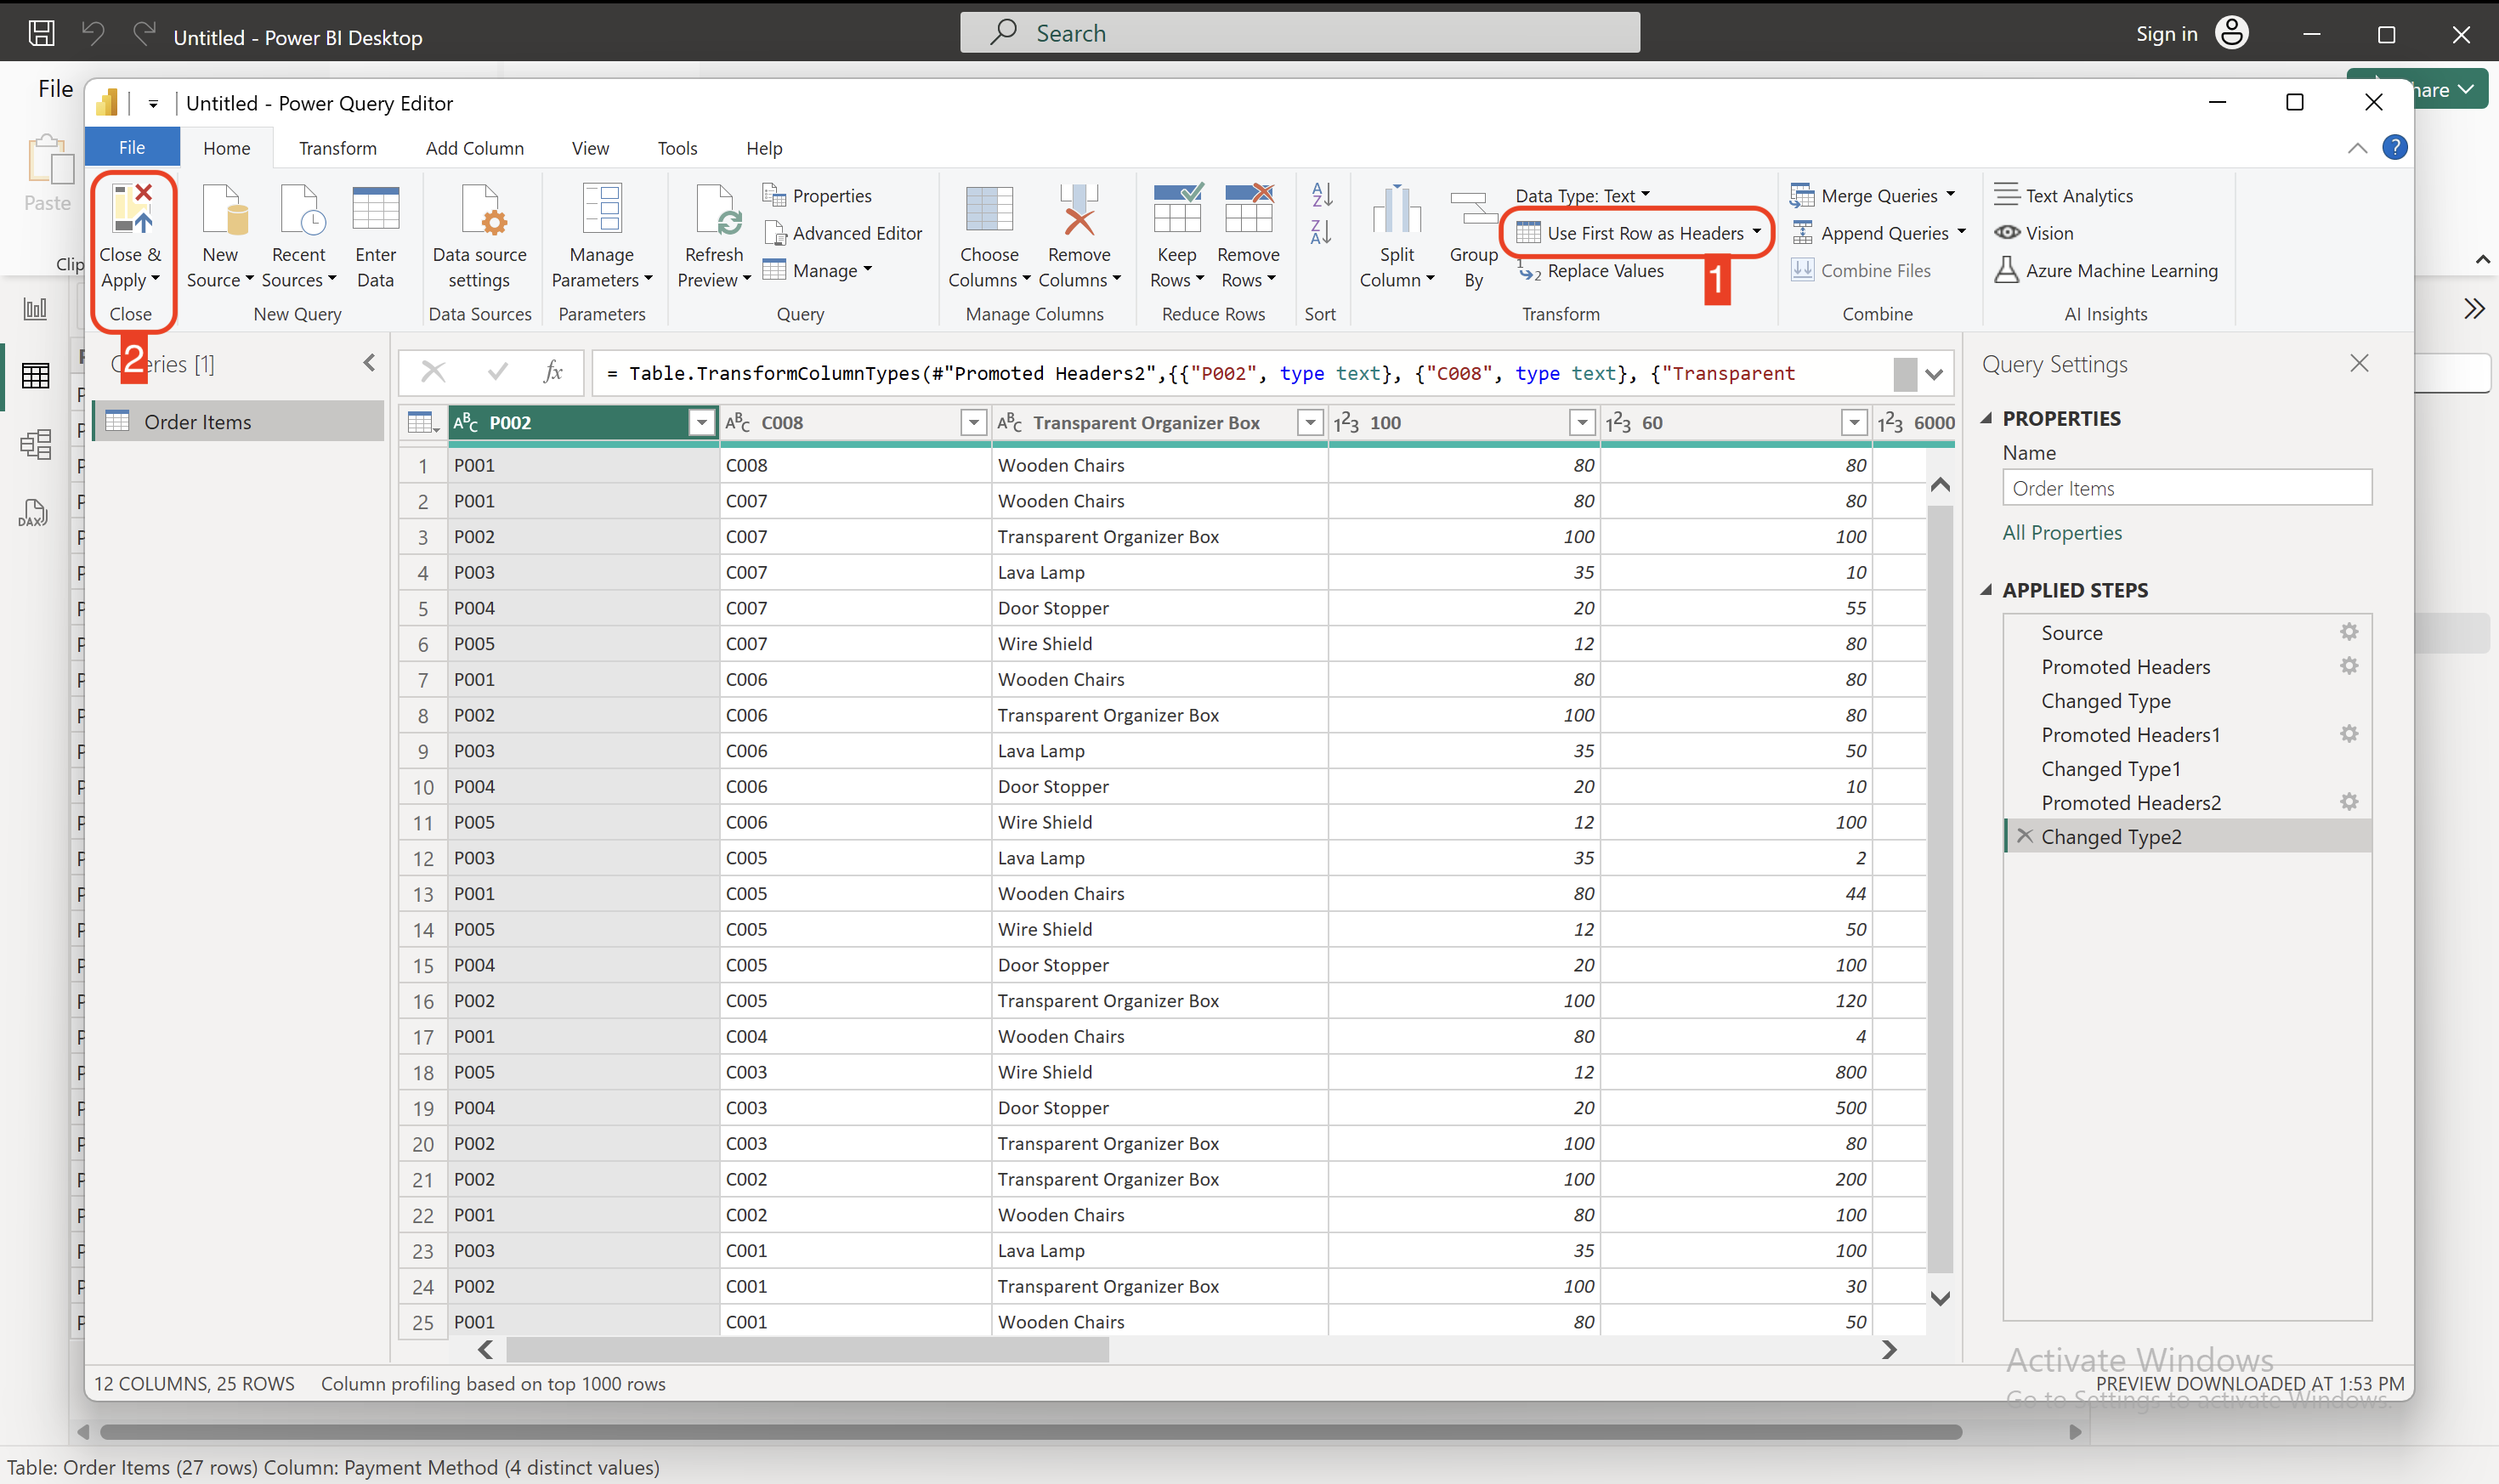
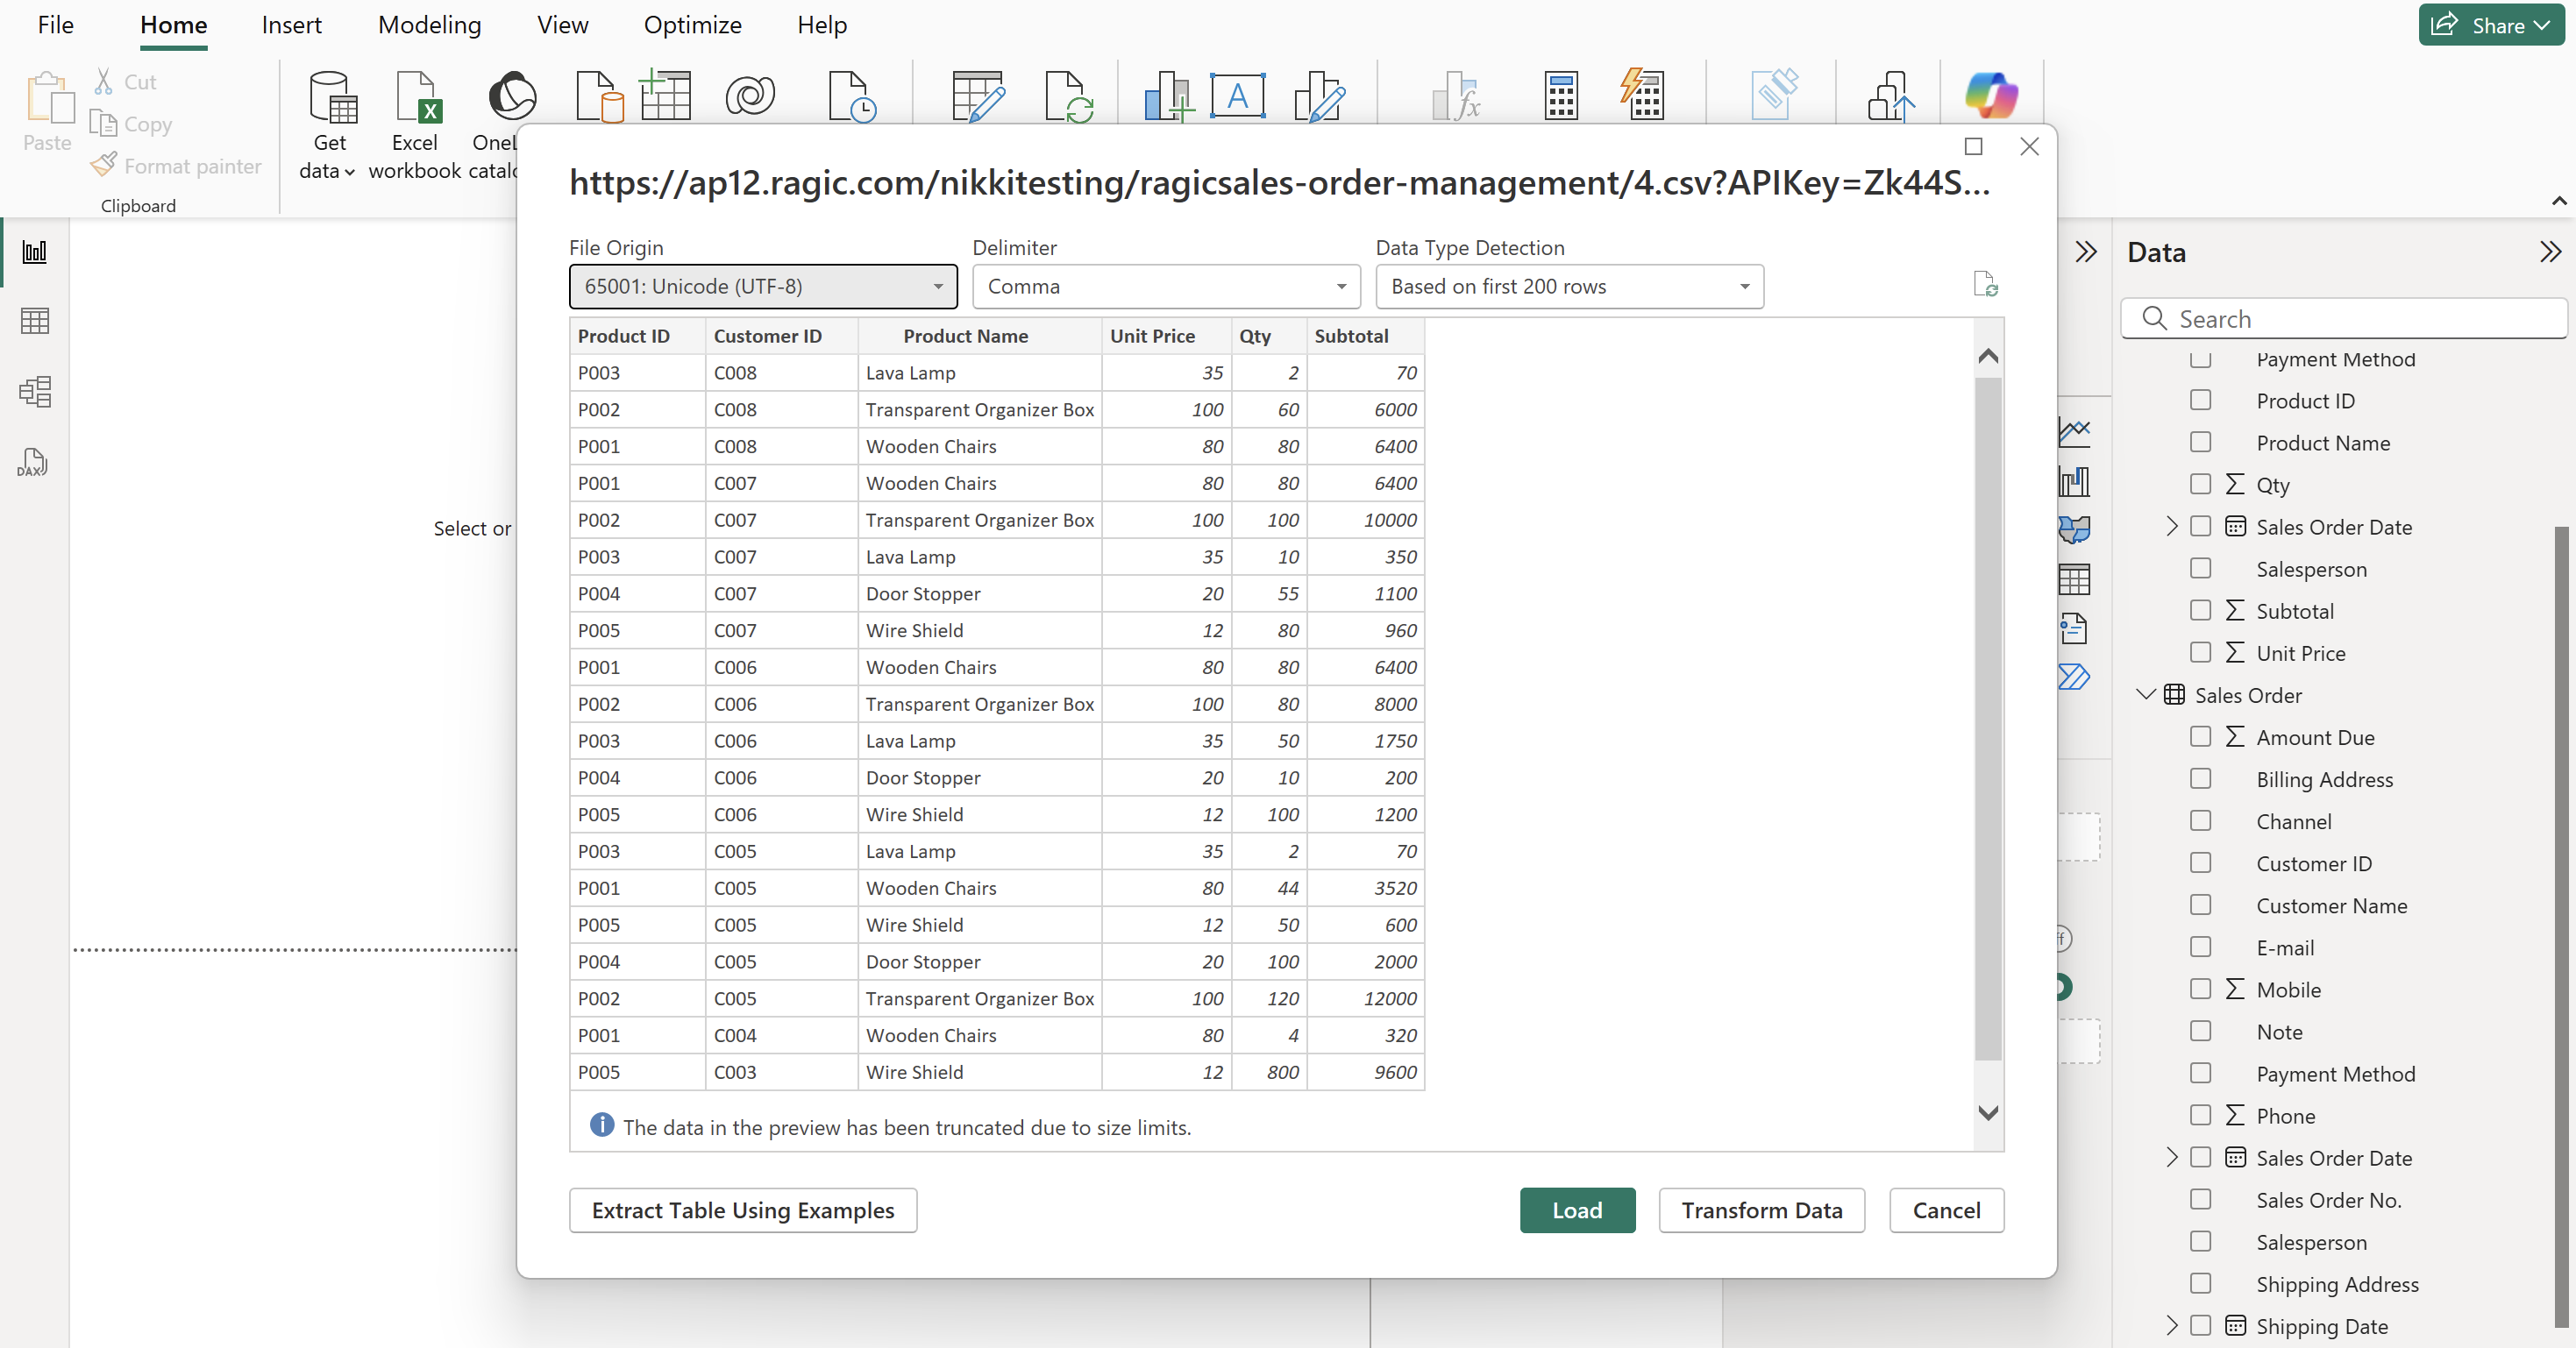
When importing data into Power BI Desktop, you might find that the first row of data is not correctly identified as a header. In this case, you need to click "Transform Data" and "Use first row as headers." If the title of the column is read correctly and the data is correct, you can directly select "Load" to start creating your dashboard.
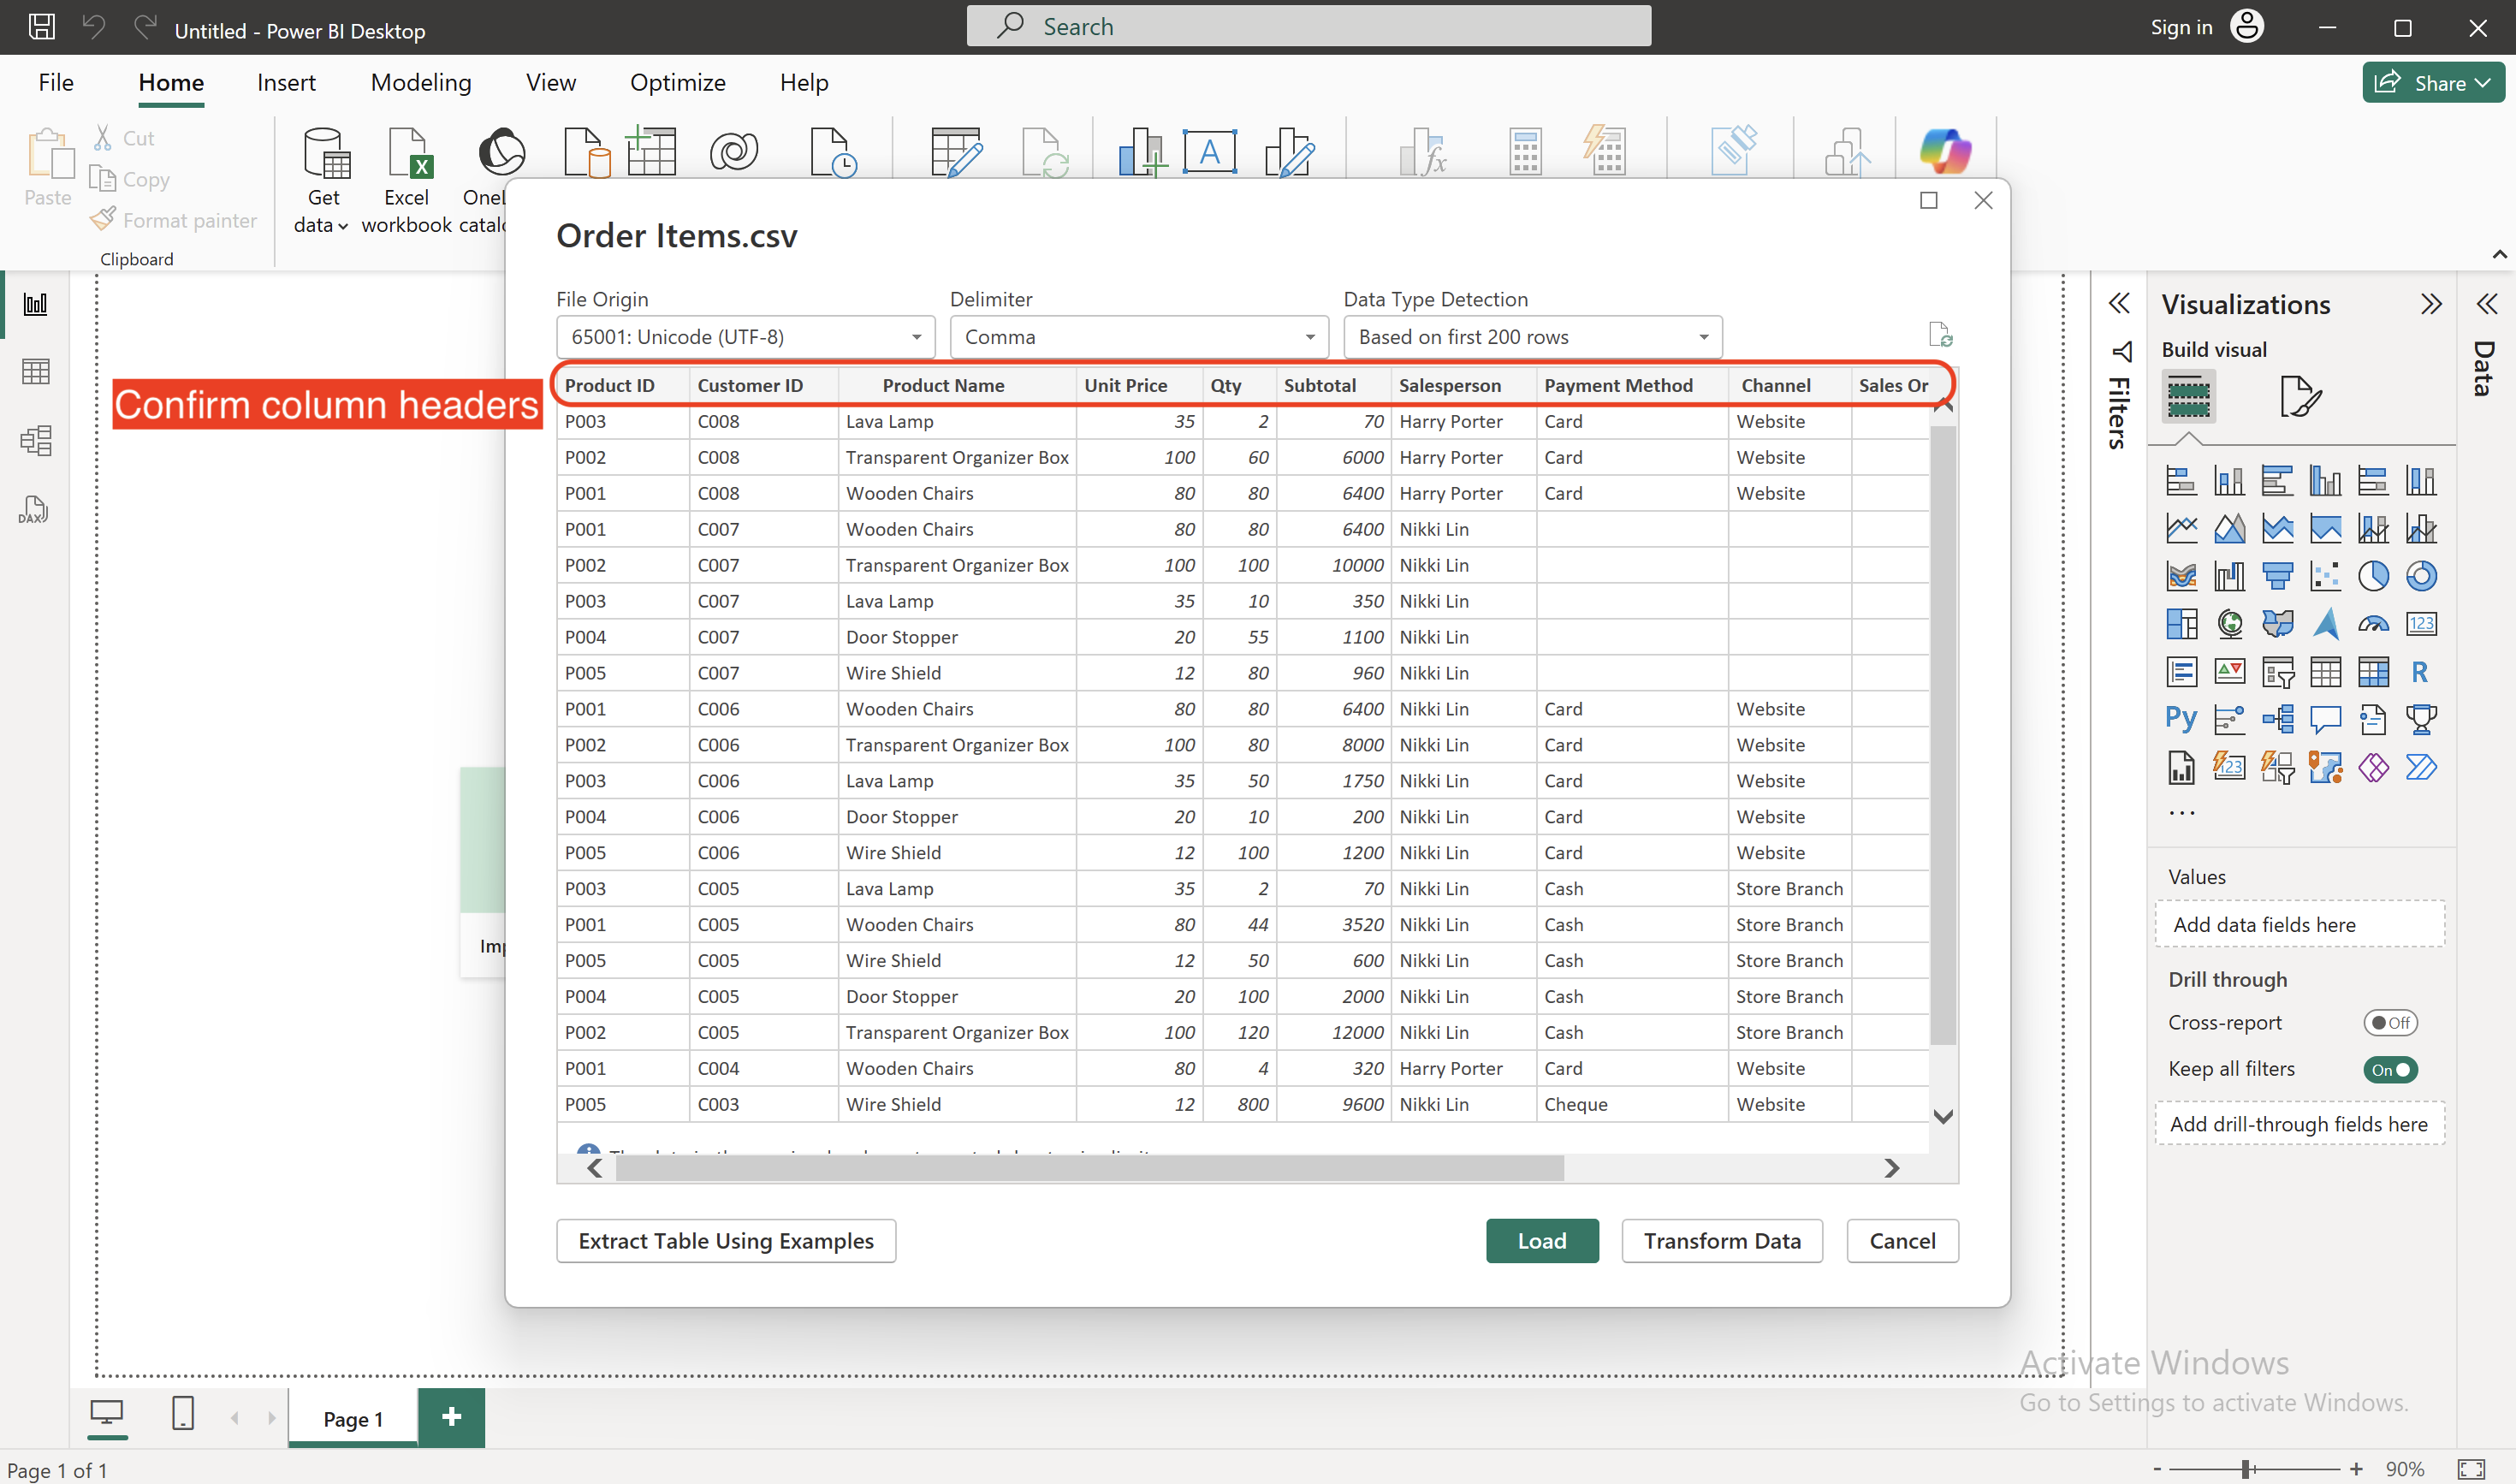
If you find that the first row is not correctly identified as a header, you need to select "Transform Data" and follow the steps below:
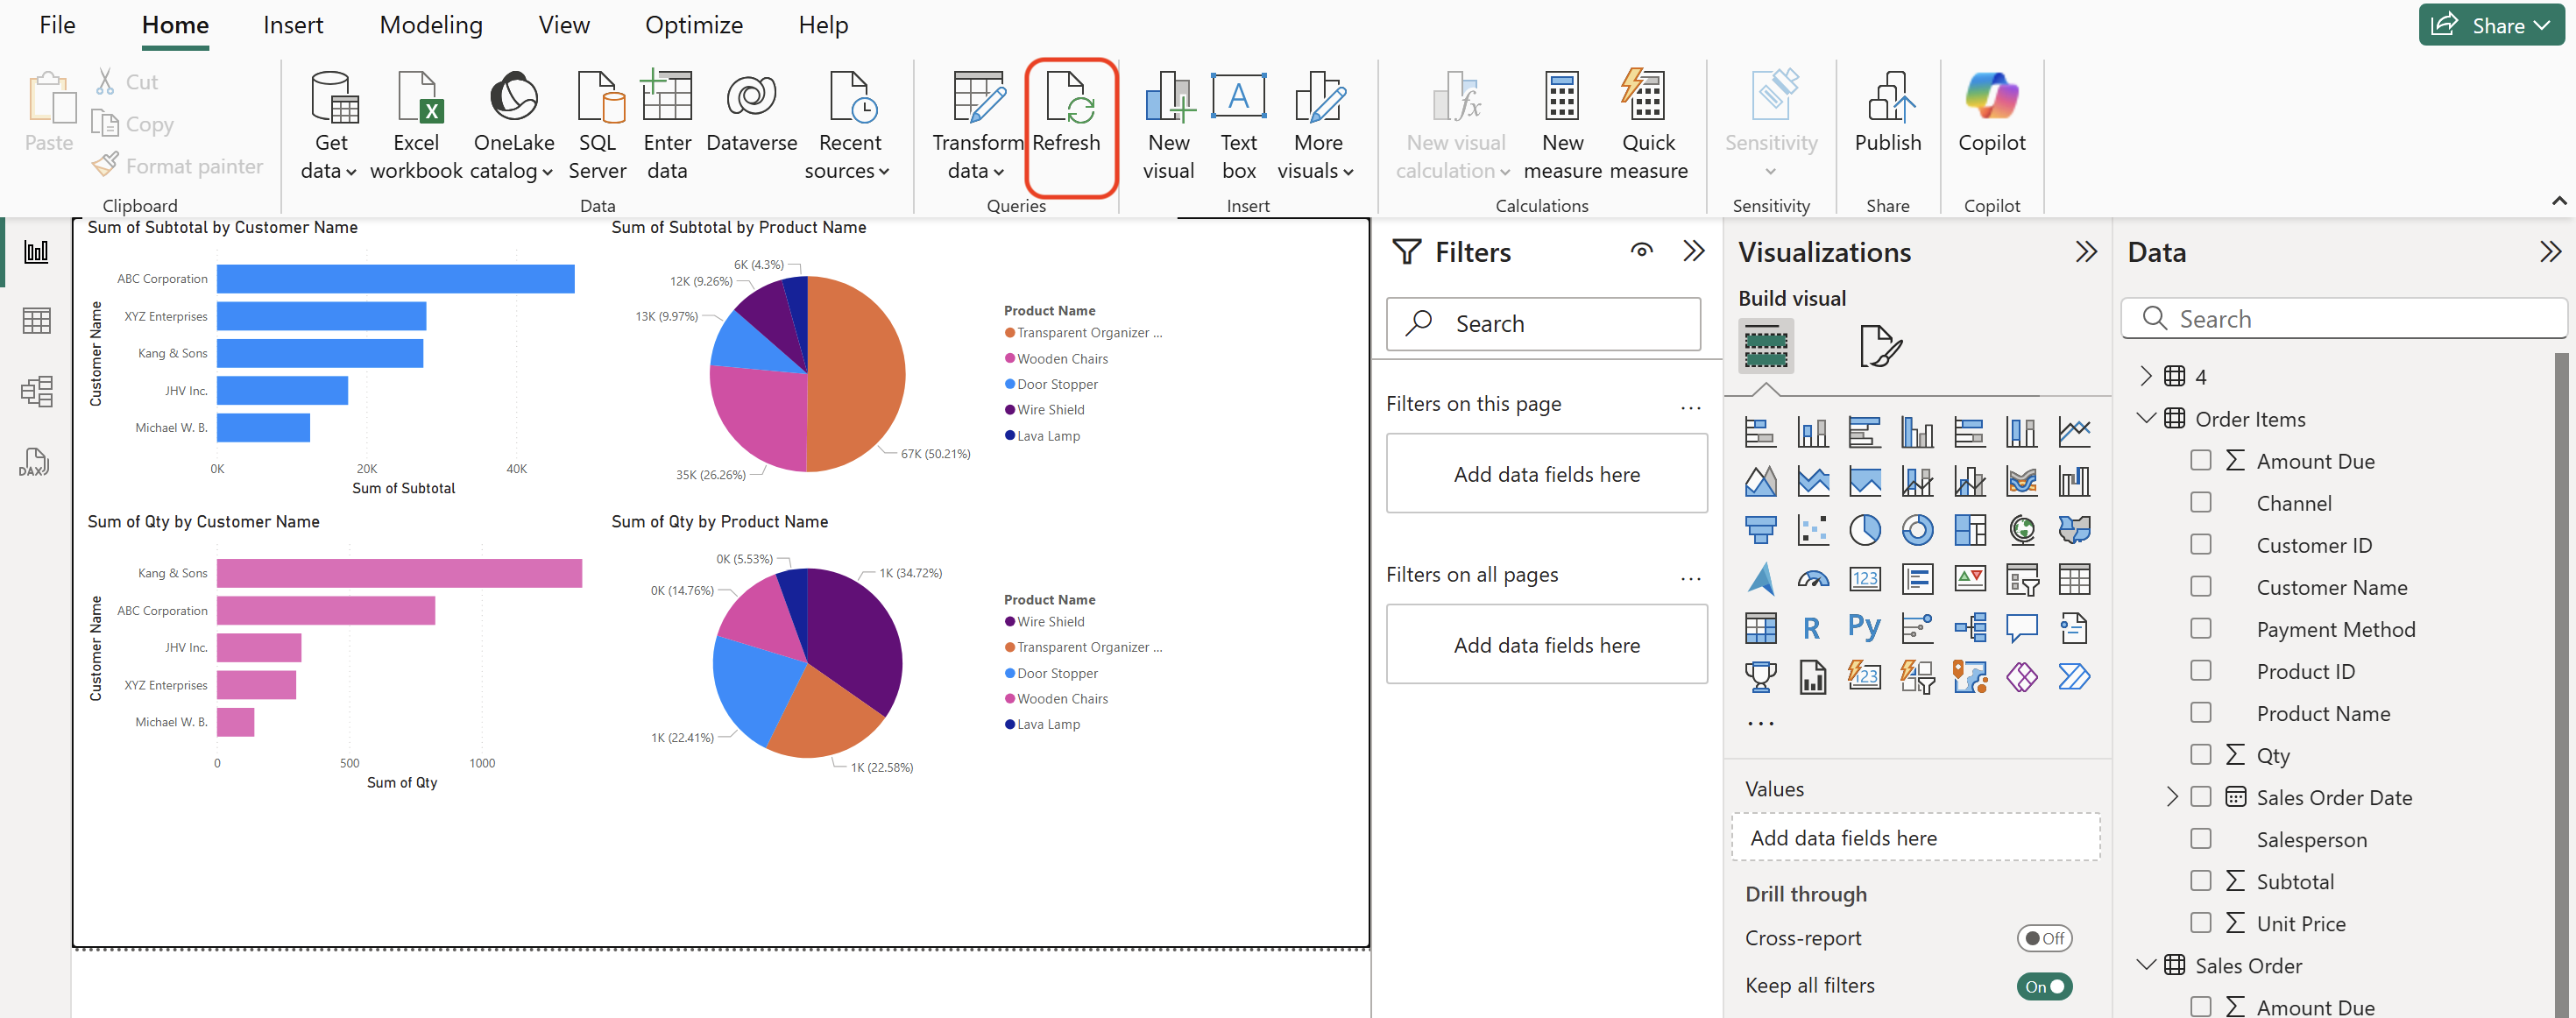
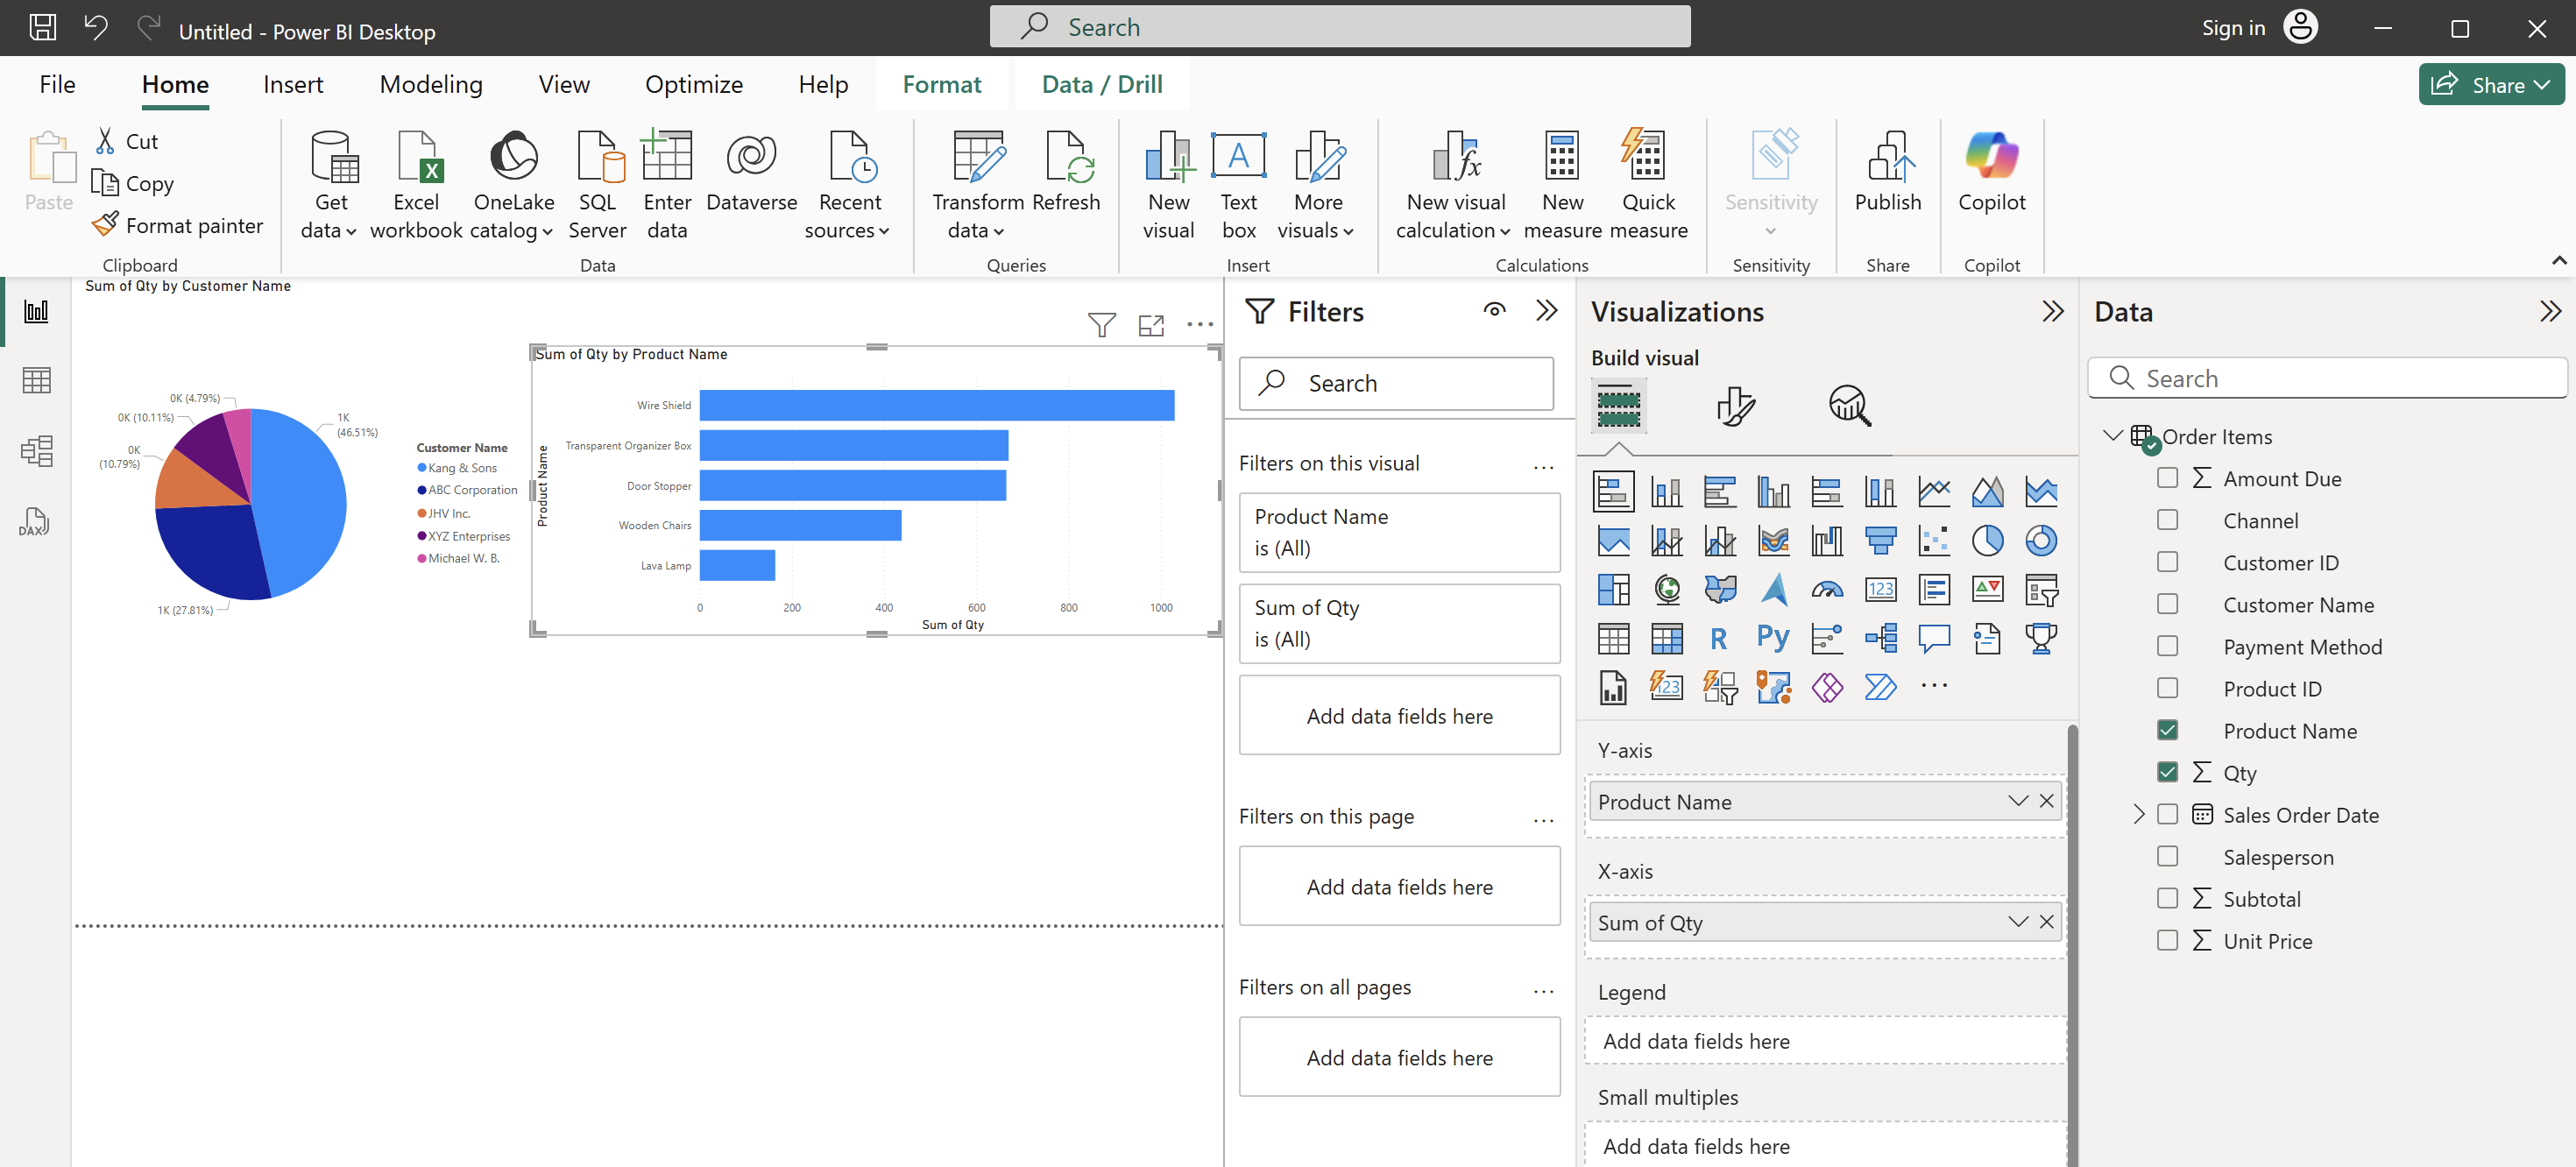
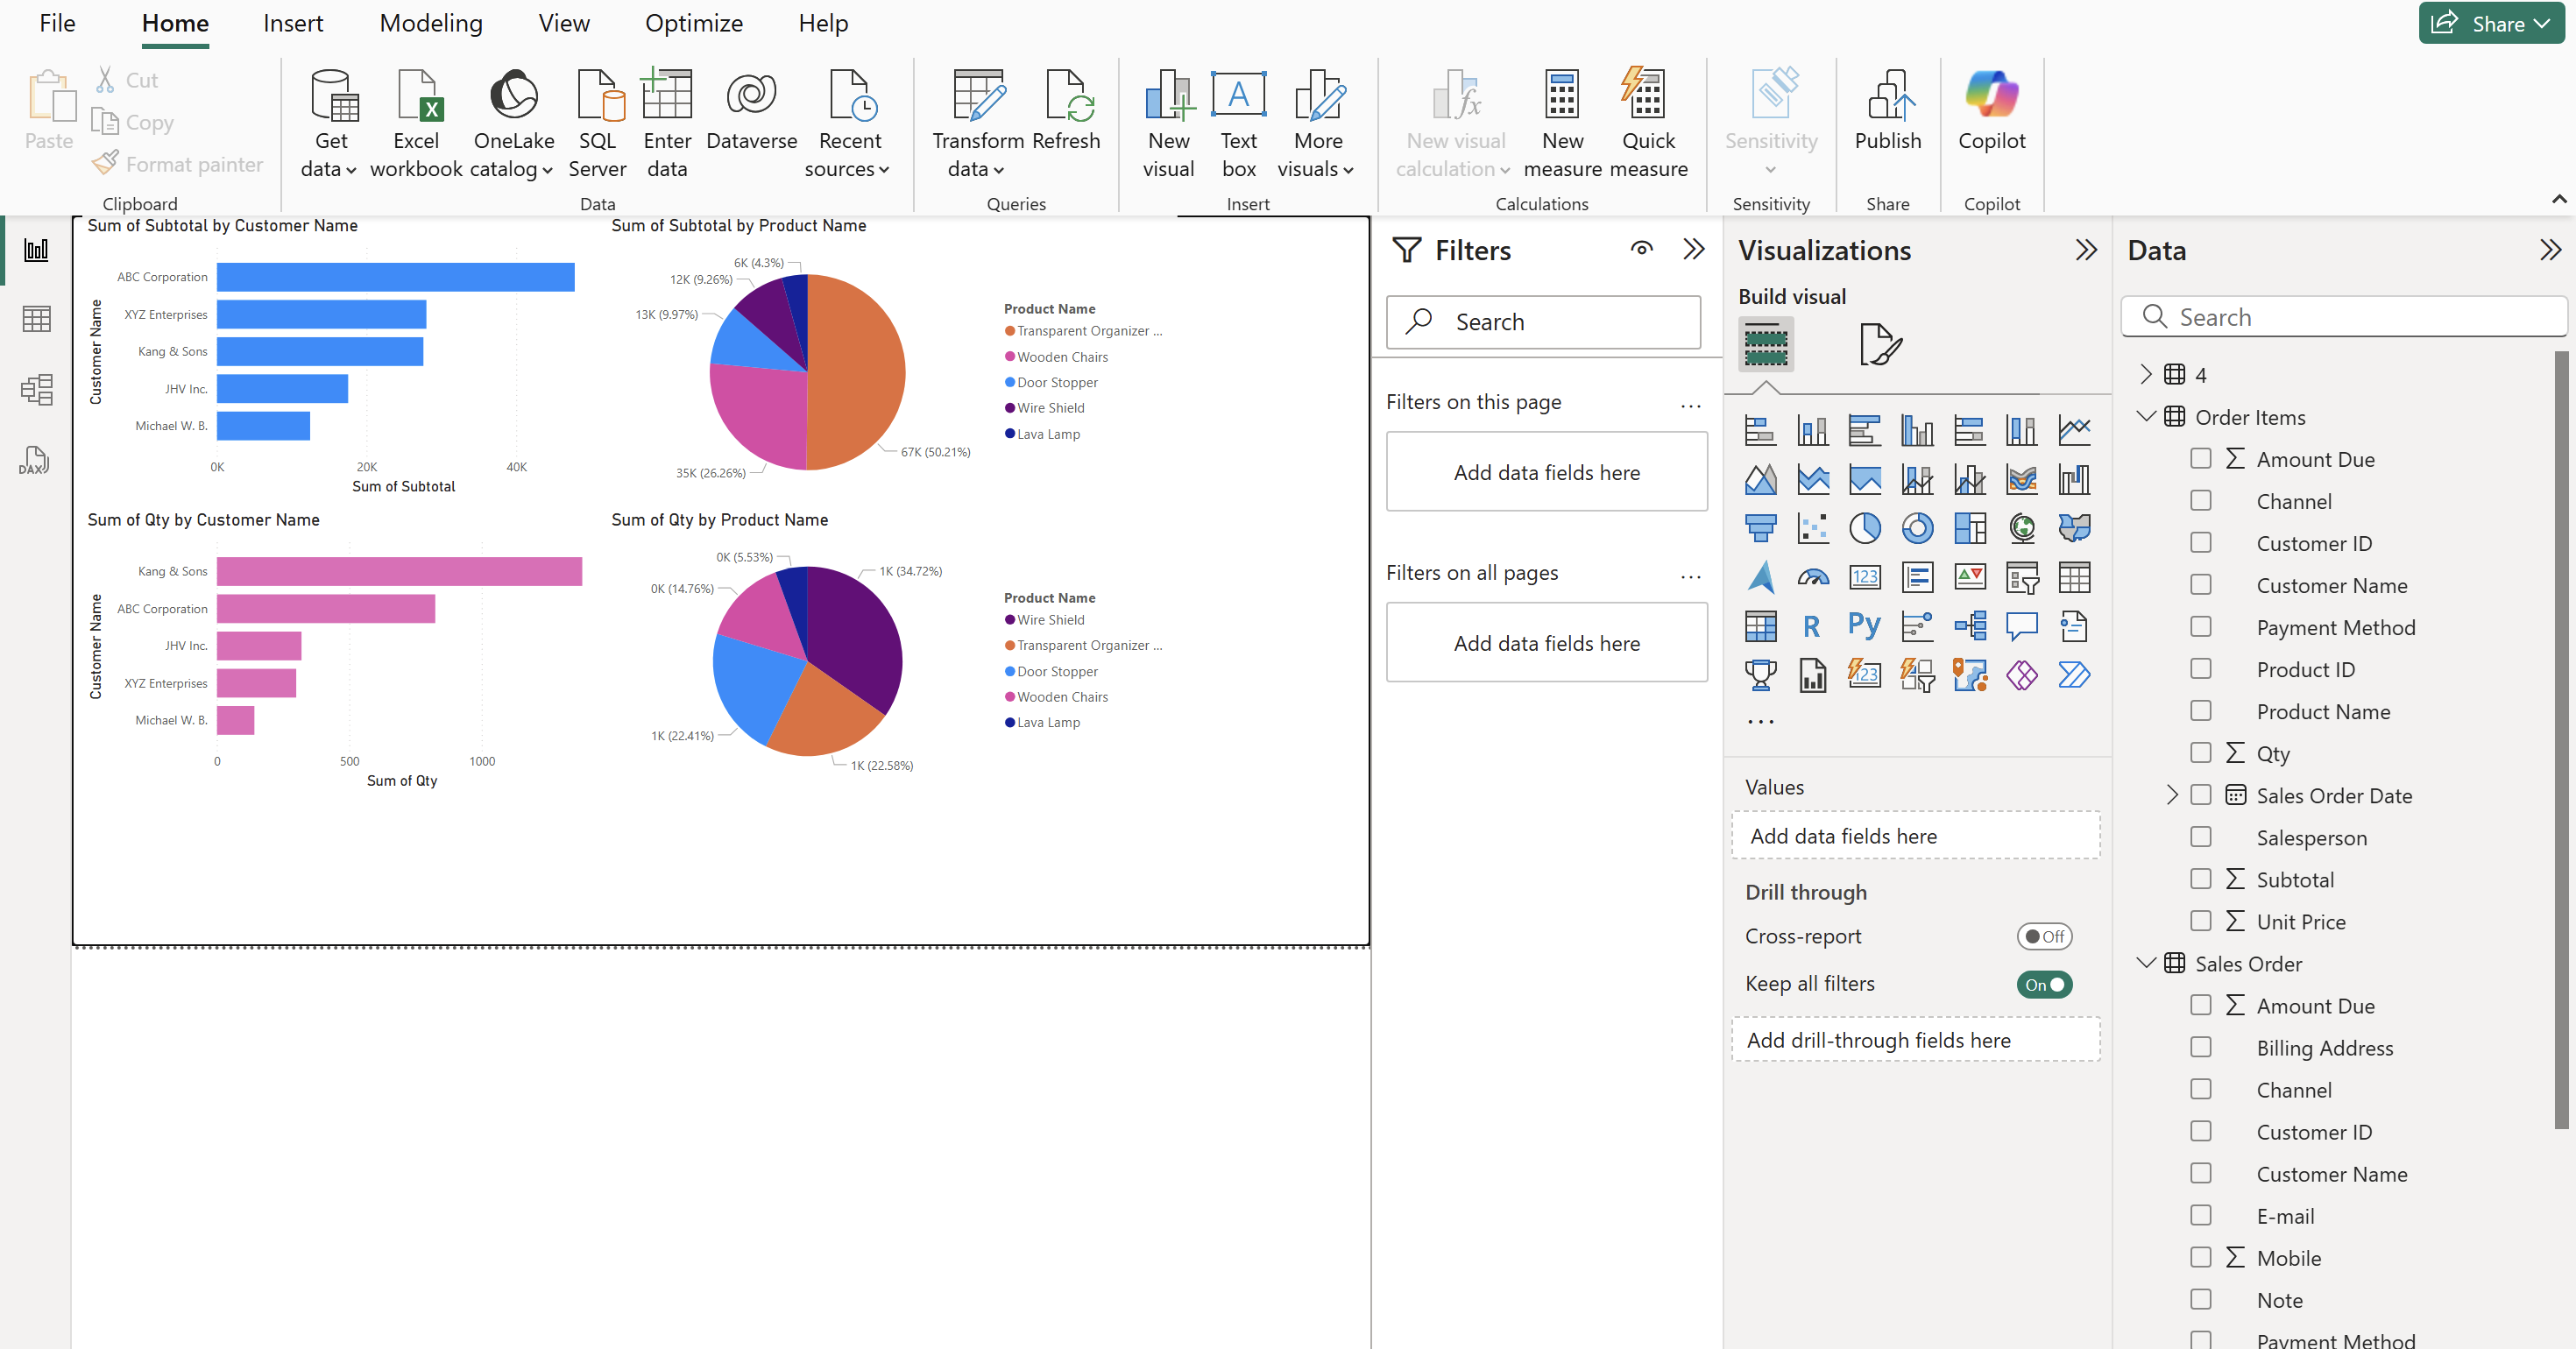
After confirming that the data has been imported correctly, you can start creating the dashboard you need! Select the required chart type, tick the columns you would like to analyze, and generate a chart for analysis:
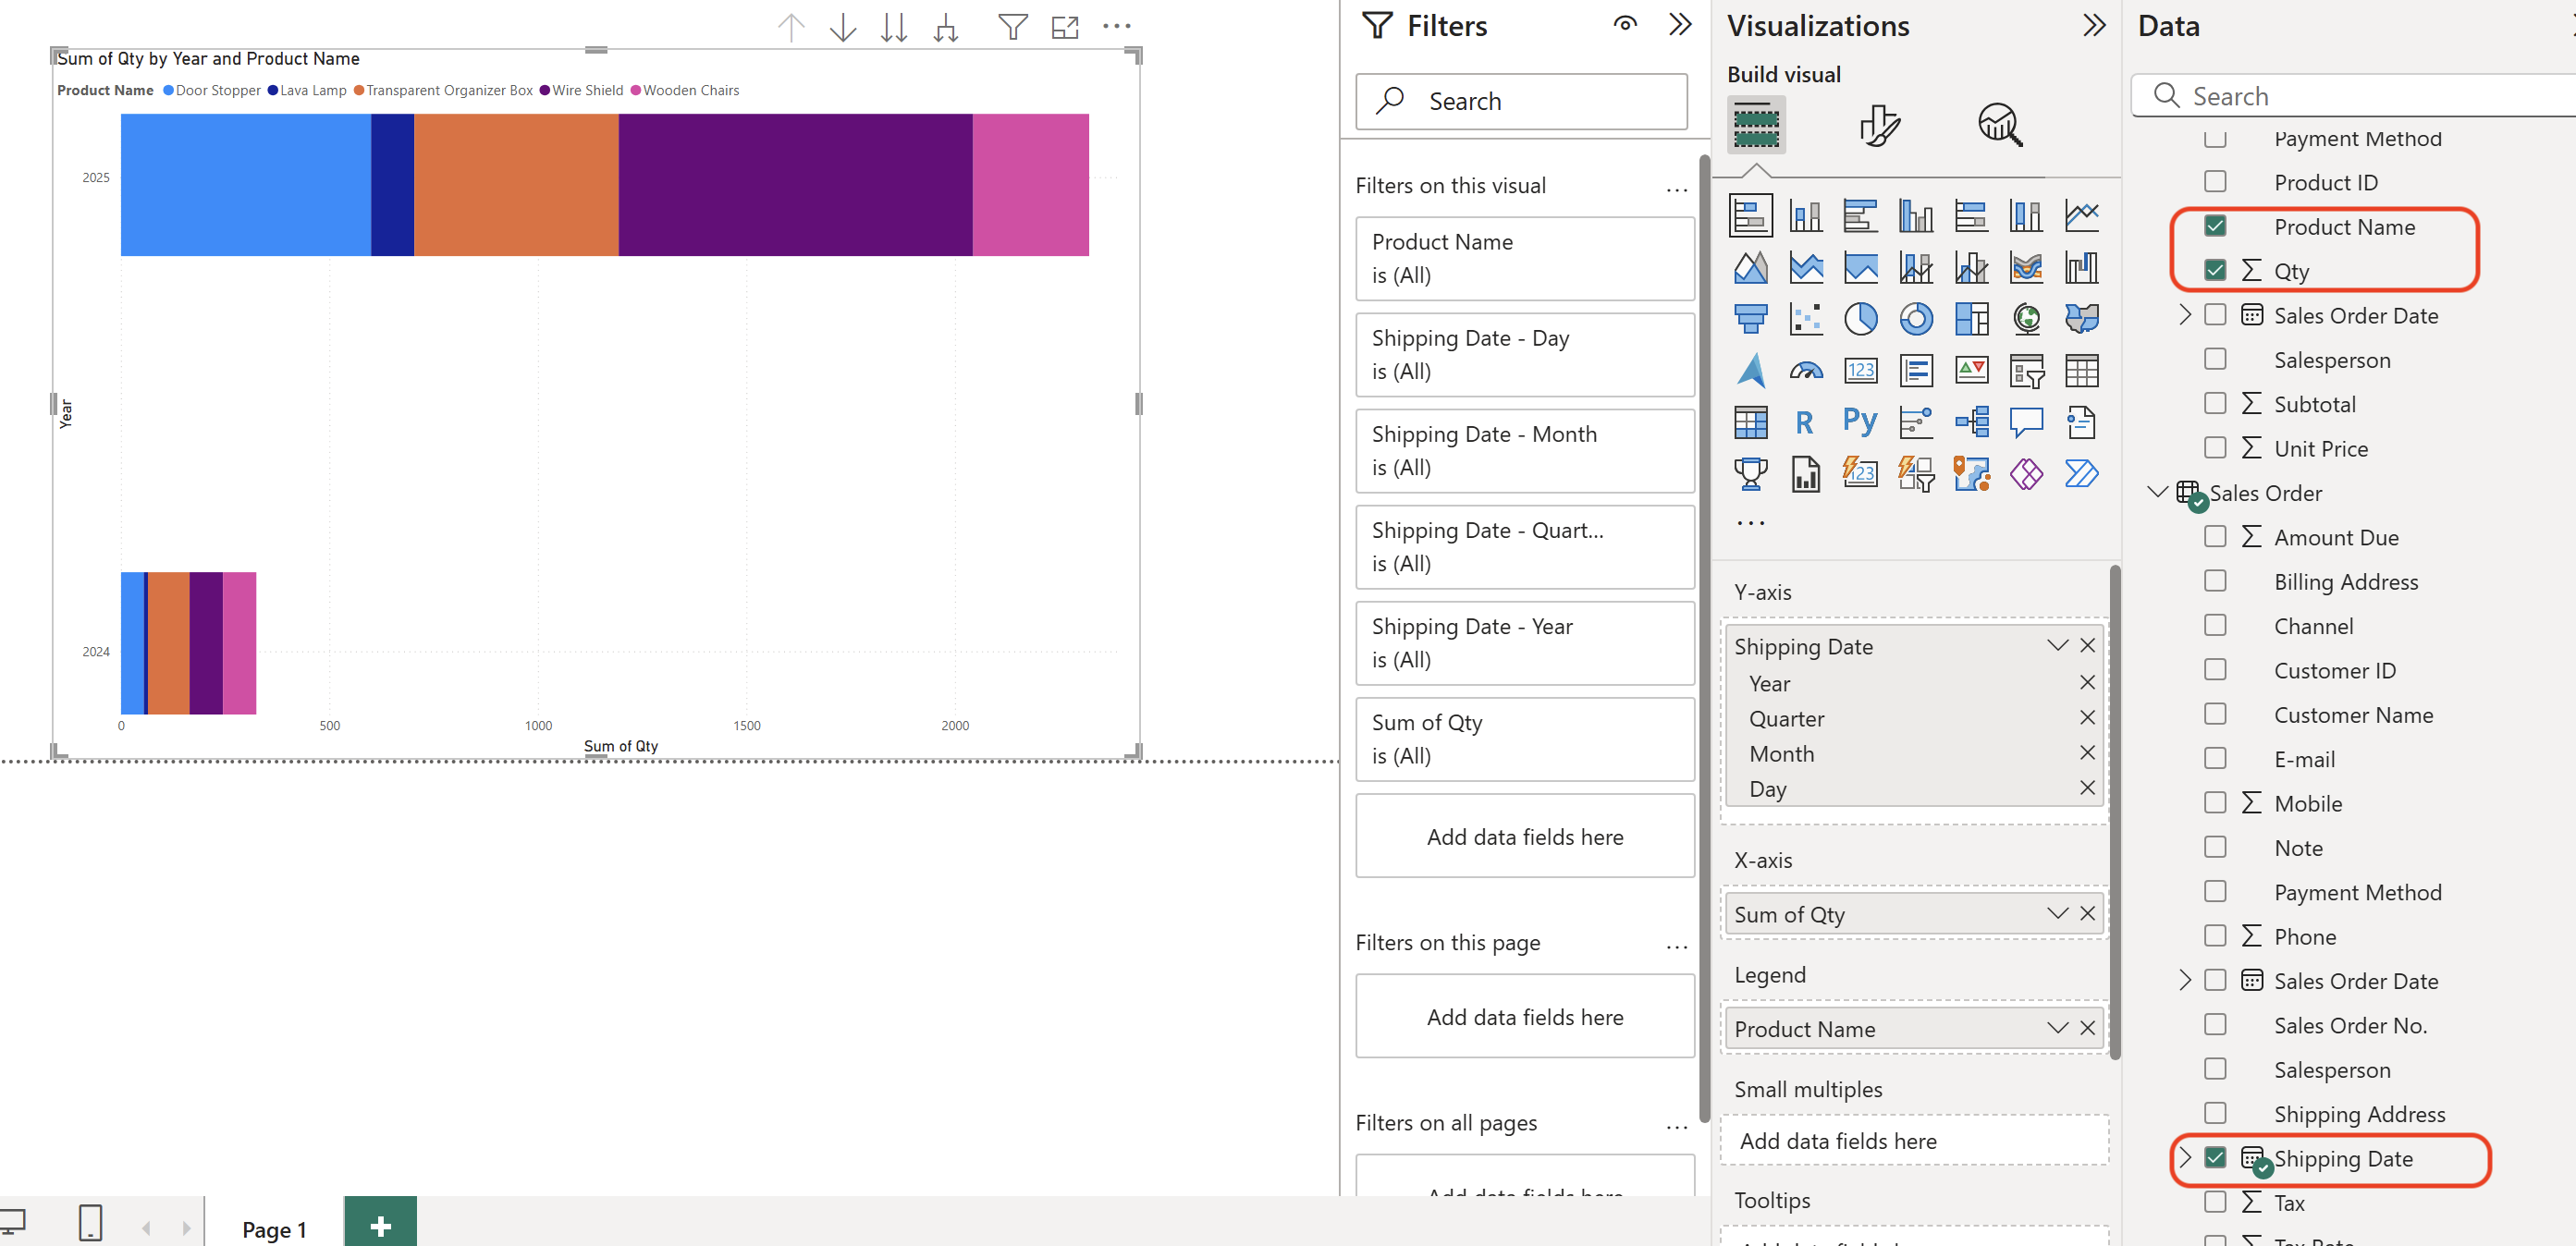
After creating multiple charts, you can also rearrange them using drag-and-drop to create dynamic dashboards that are easy to read:
When using Power BI Desktop, you can link two different files within the same key value (eg. A unique value such as an order number), so data analysis becomes more flexible. You don't need to add original form fields before downloading the data. Just download "Sales Order" and "Order Details" separately and import them into Power BI. Power BI will automatically establish the association.
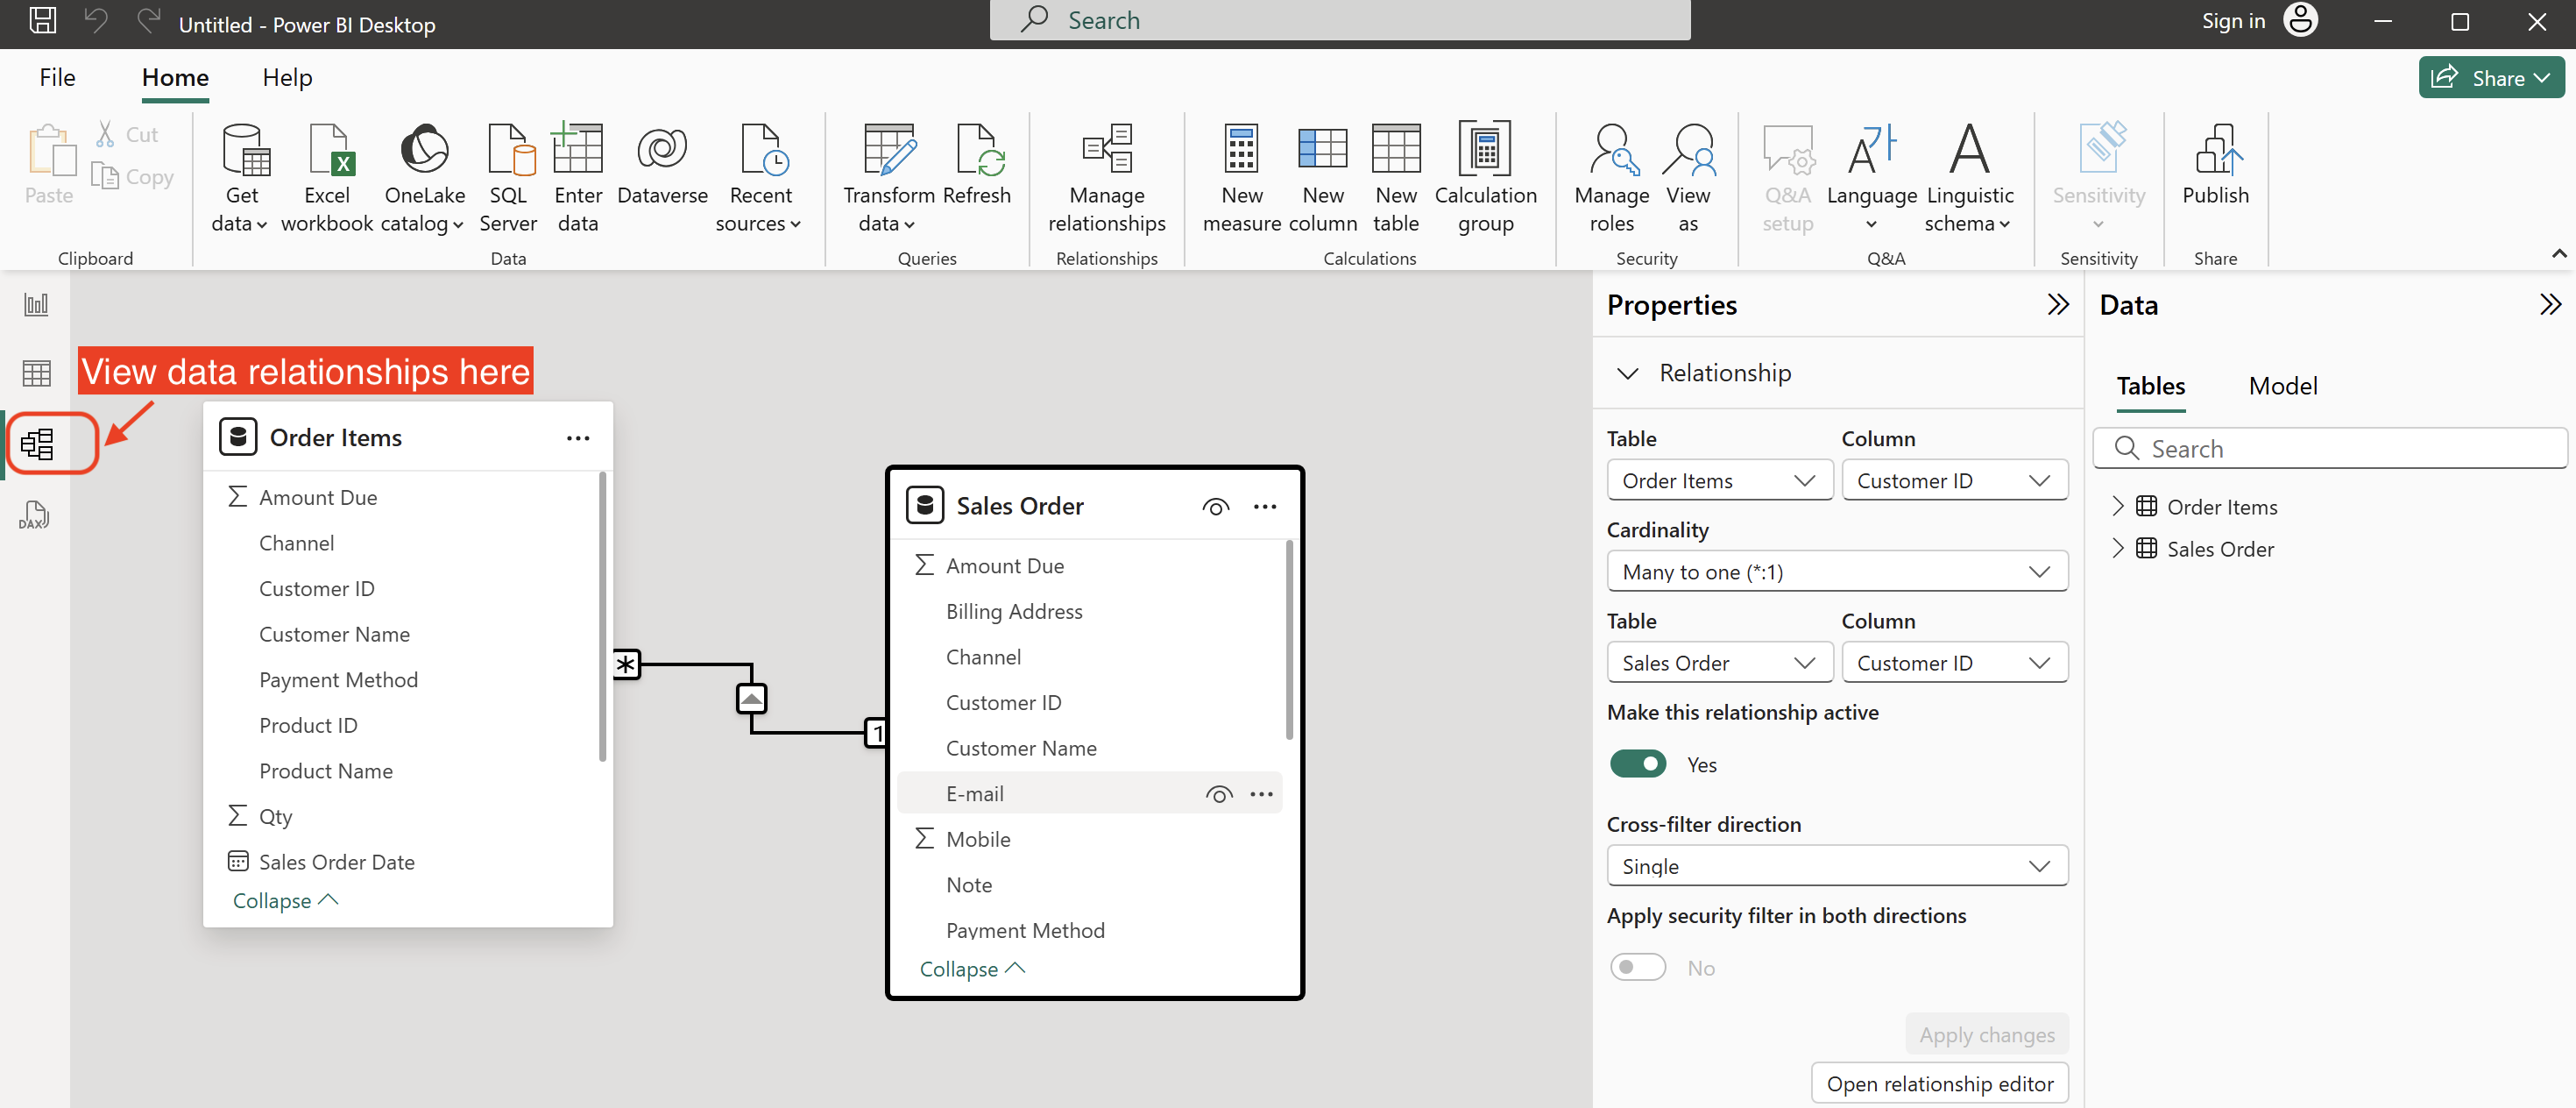
By default, Power BI Desktop will compare and link the 2 sheets through their field names. You can also select the fields you would like to link. Once linked, it will be easier to select the data you need from different sources when creating your dashboard, making it more convenient and intuitive.
If you use Power BI Desktop and need to frequently update data, you can also choose to obtain data from the Internet and directly update the data with one click, eliminating the trouble of exporting and importing data each time.
To ensure data privacy, we recommend using we recommend using an API Key to export data. This will allow Power BI to obtain the permissions of the currently logged-in Ragic account without granting all the guests access to the form.
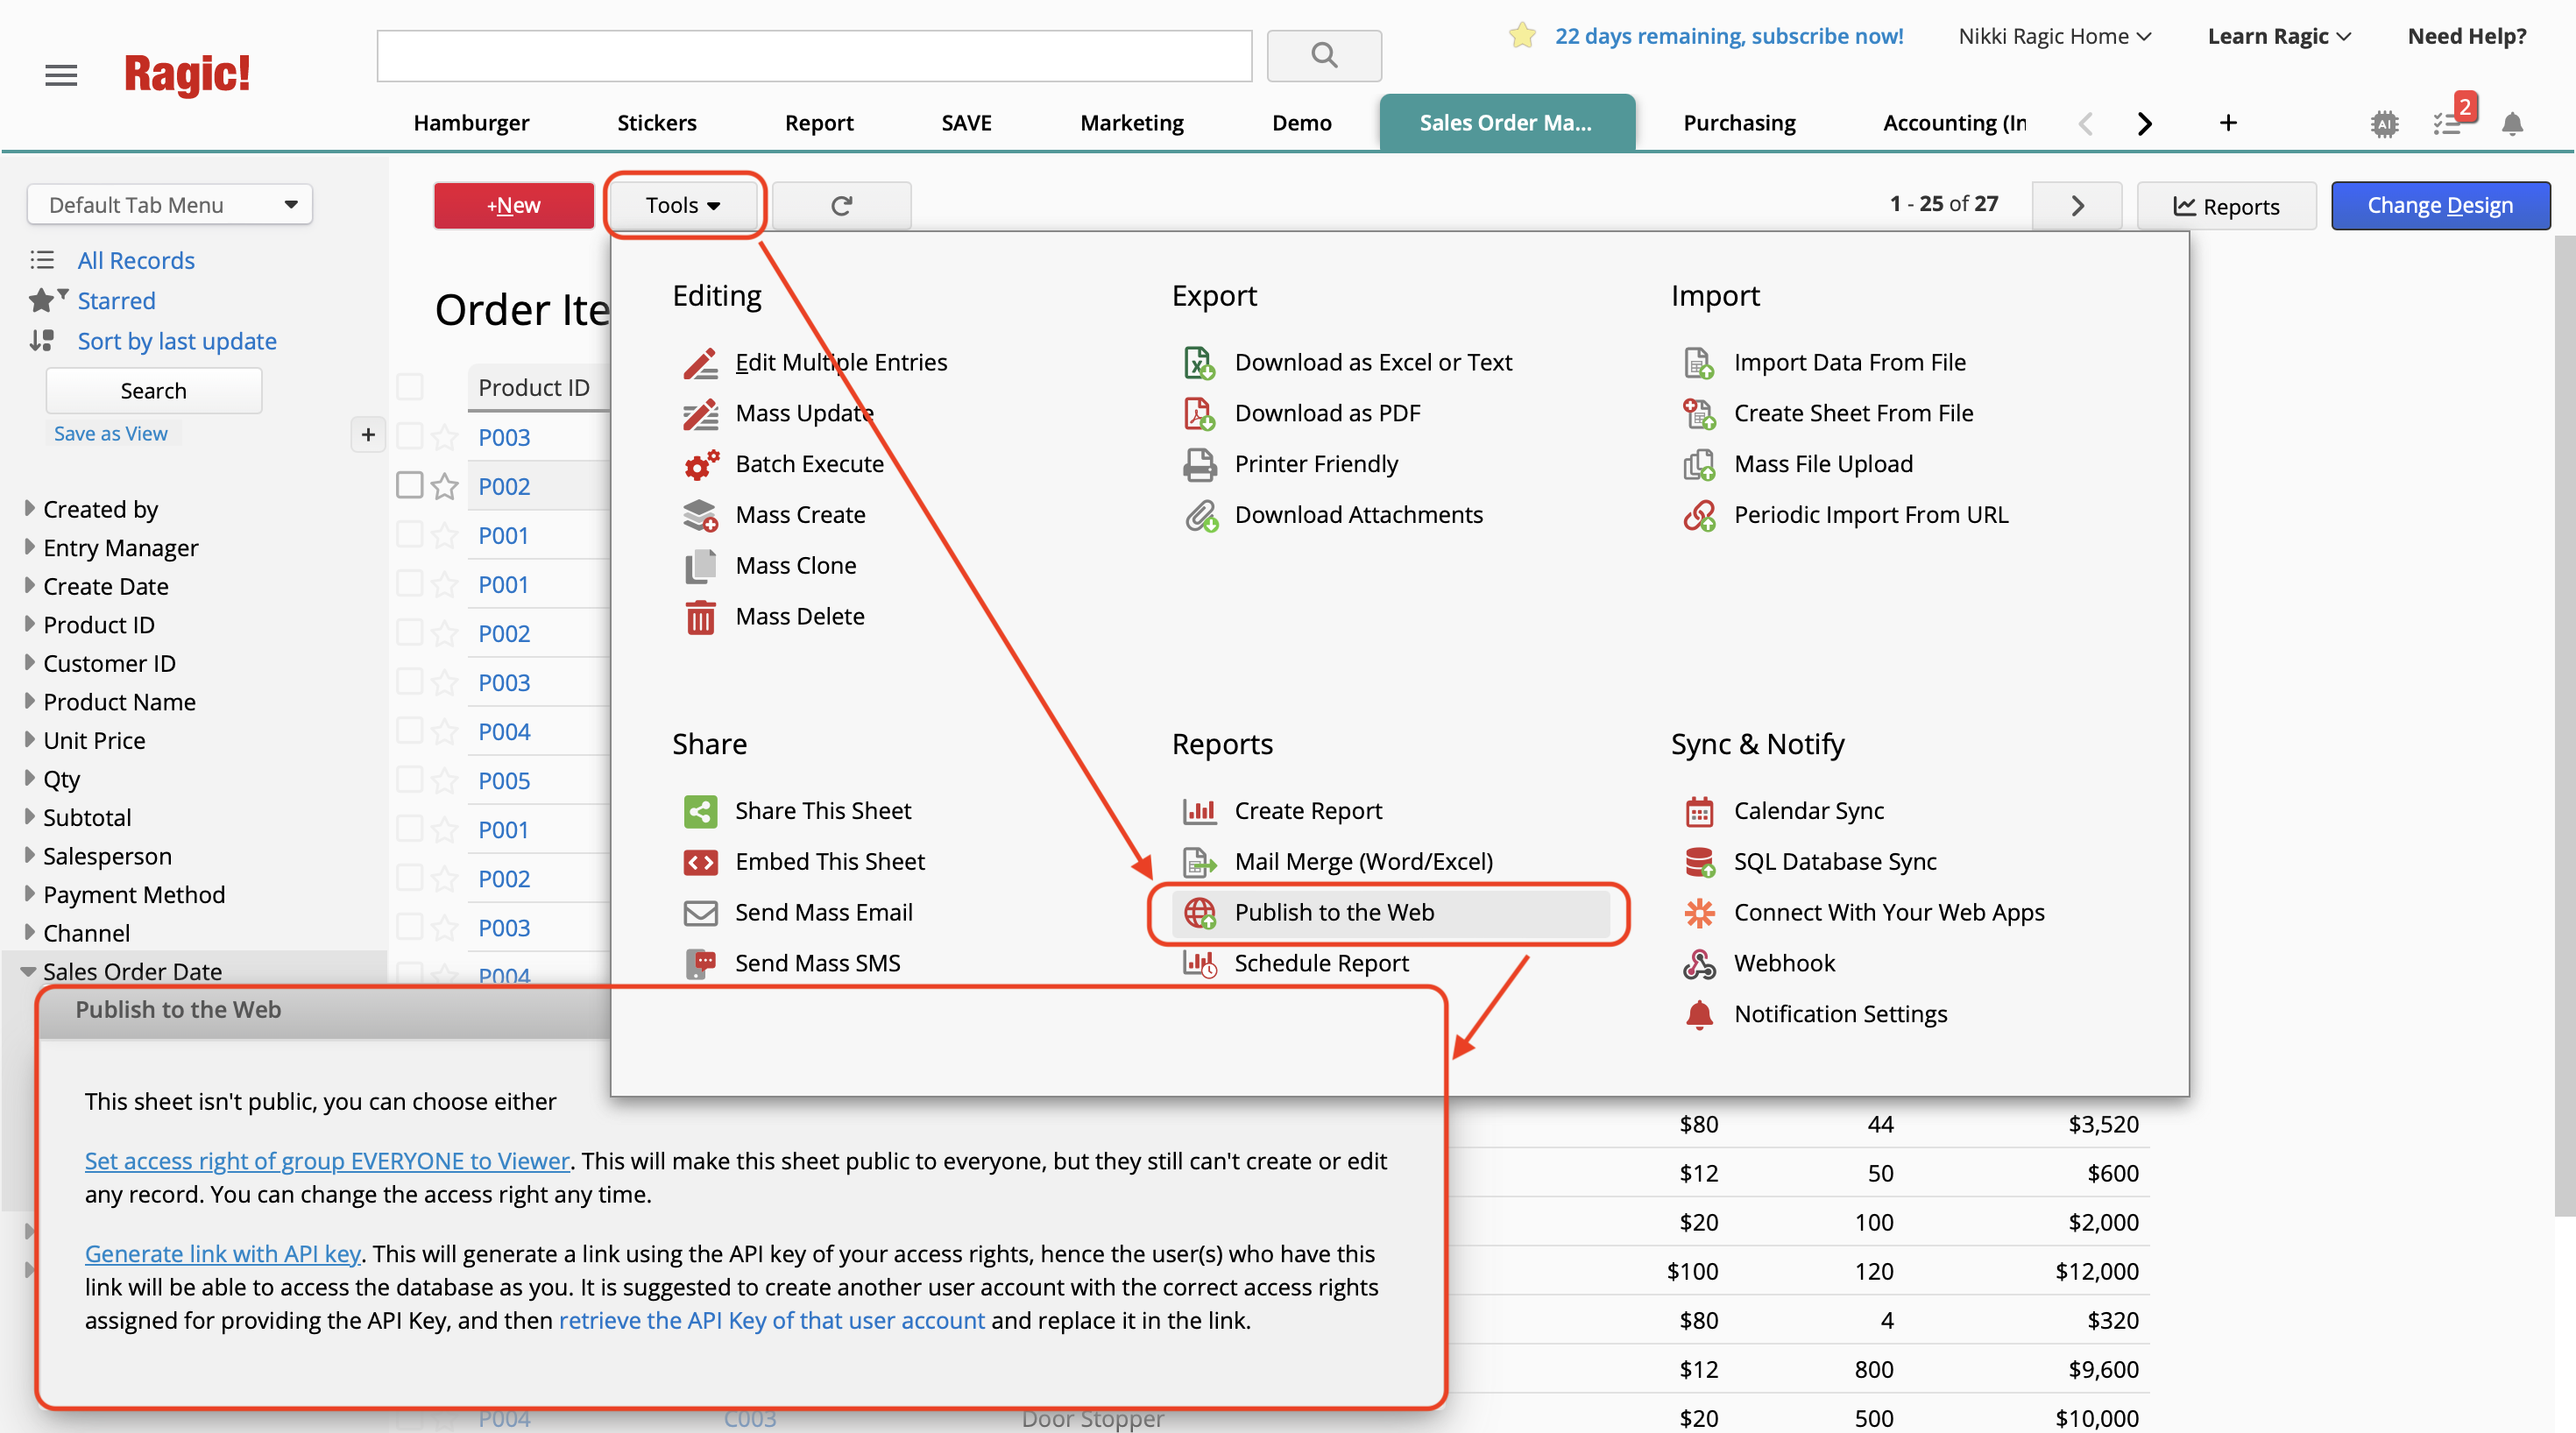
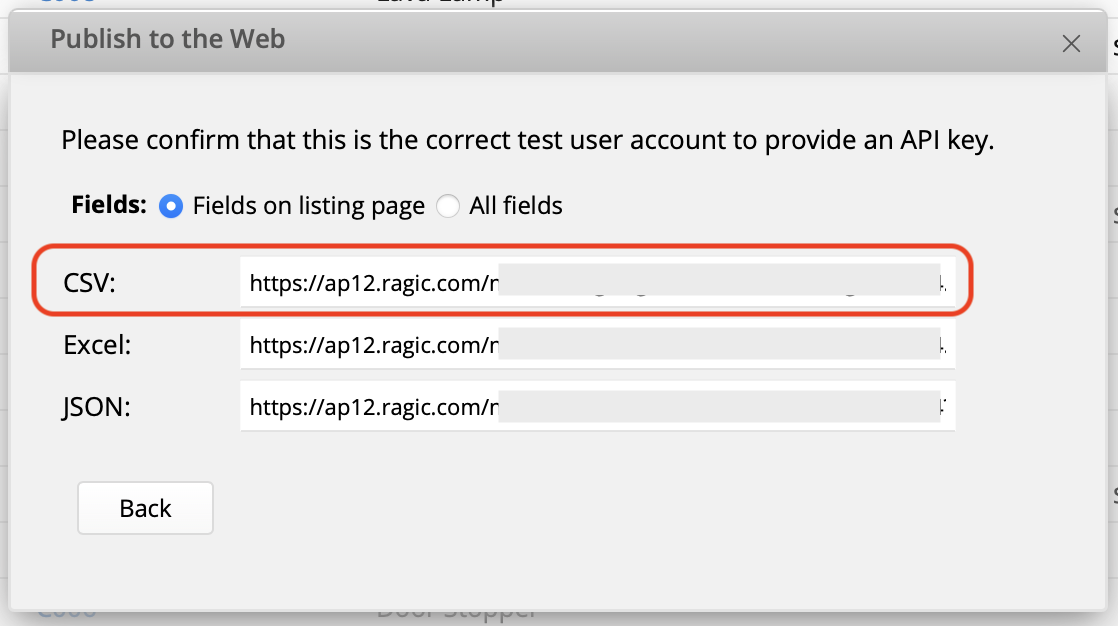
After selecting "Generate link with API key," copy the URL in the field beside "CSV." This will give you a link to the data stored in CSV format that contains the current user's access rights.
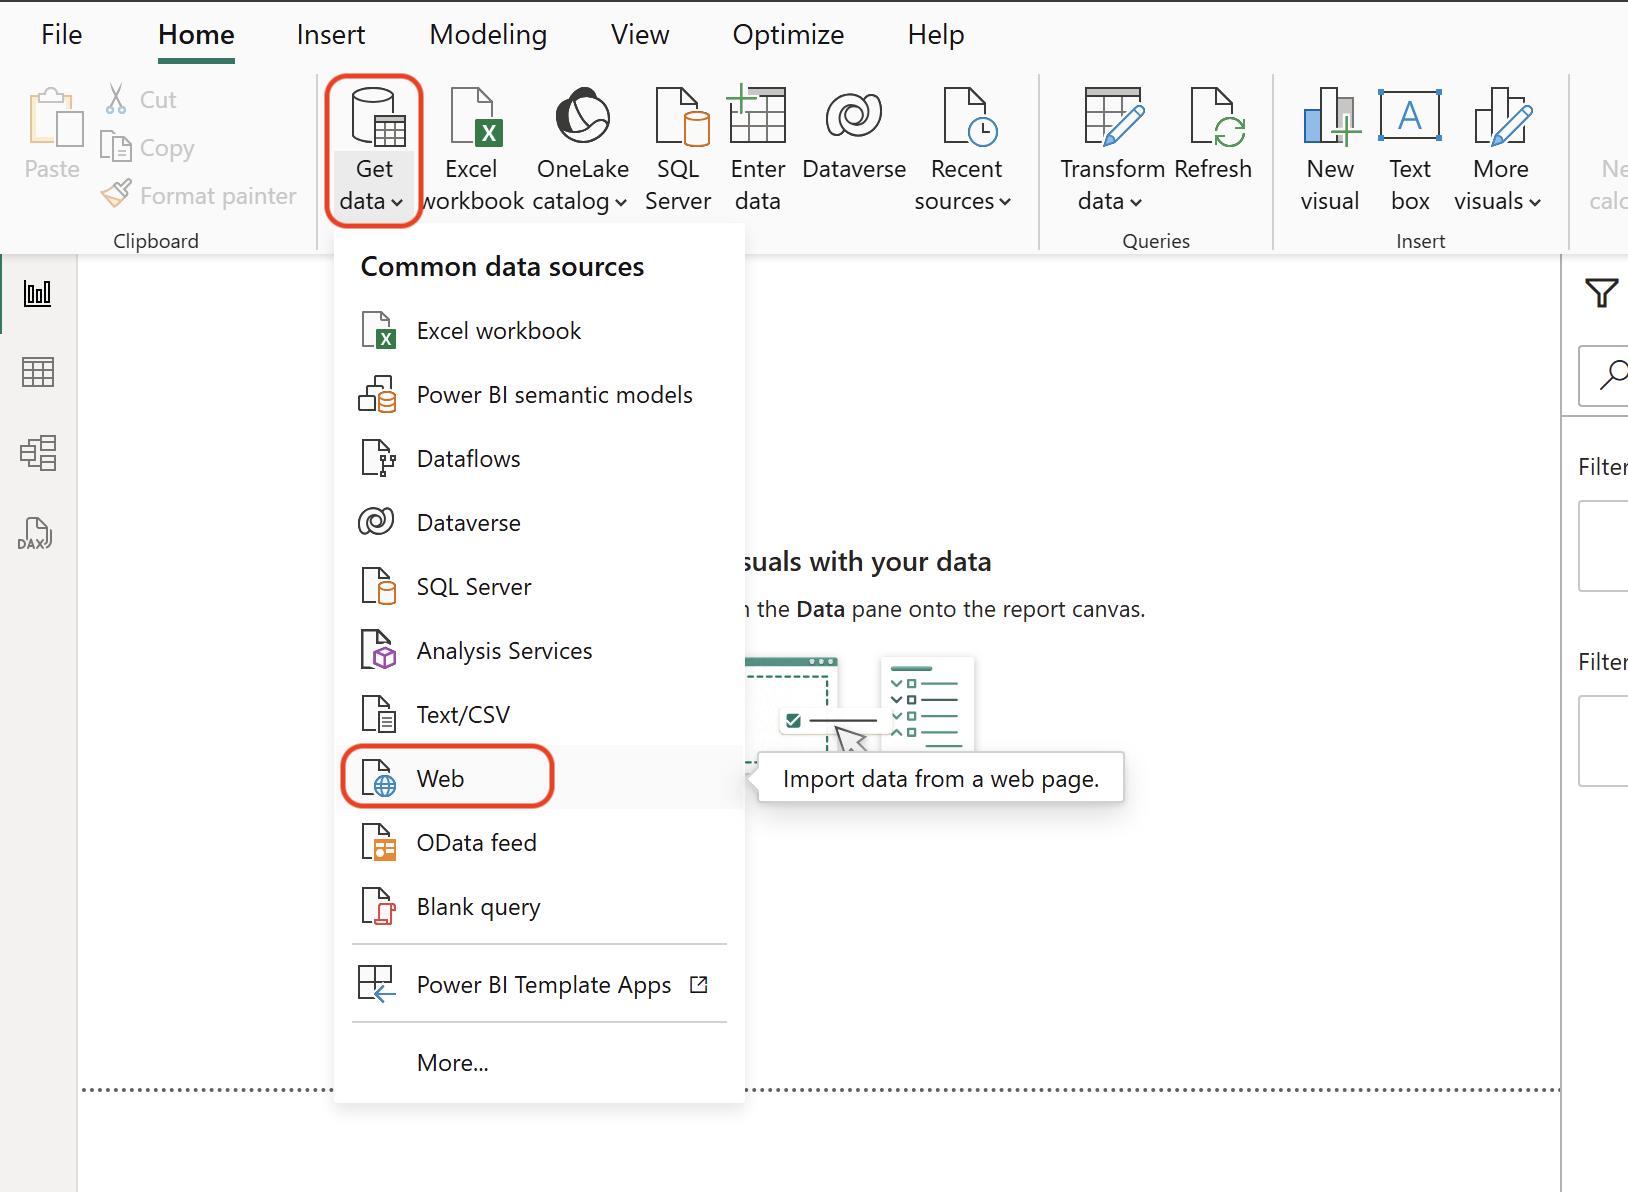
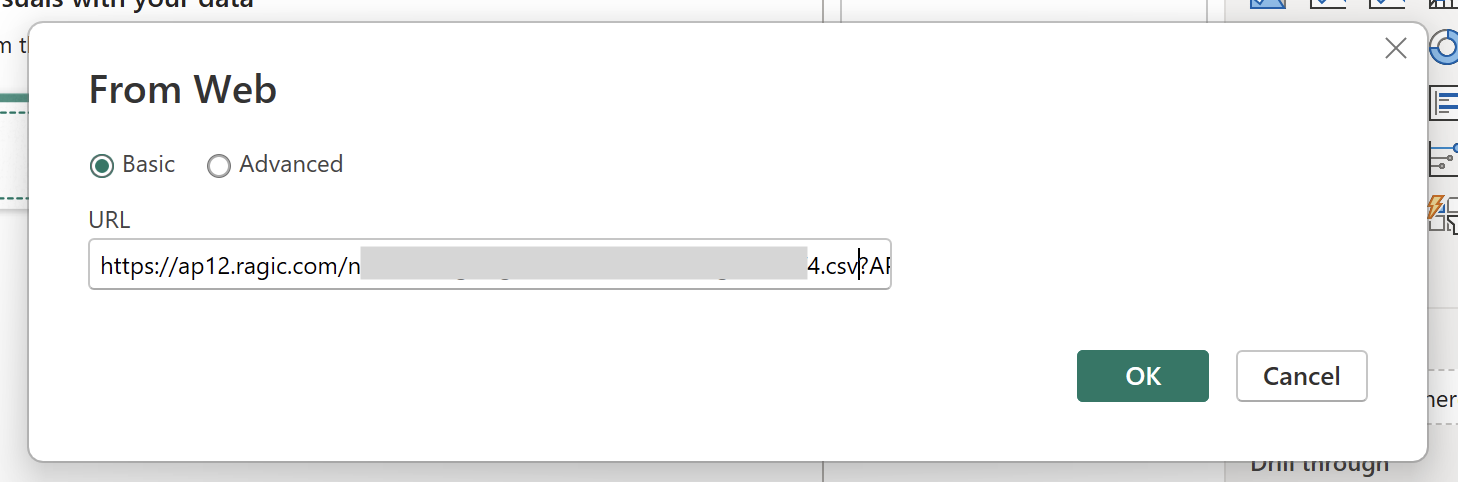
After copying Ragic's API Key, return to Power BI Desktop and select "Get Data" → "Web" and paste the URL you just copied to successfully fetch the data.
After importing and confirming the data, you can then start creating your dashboard.
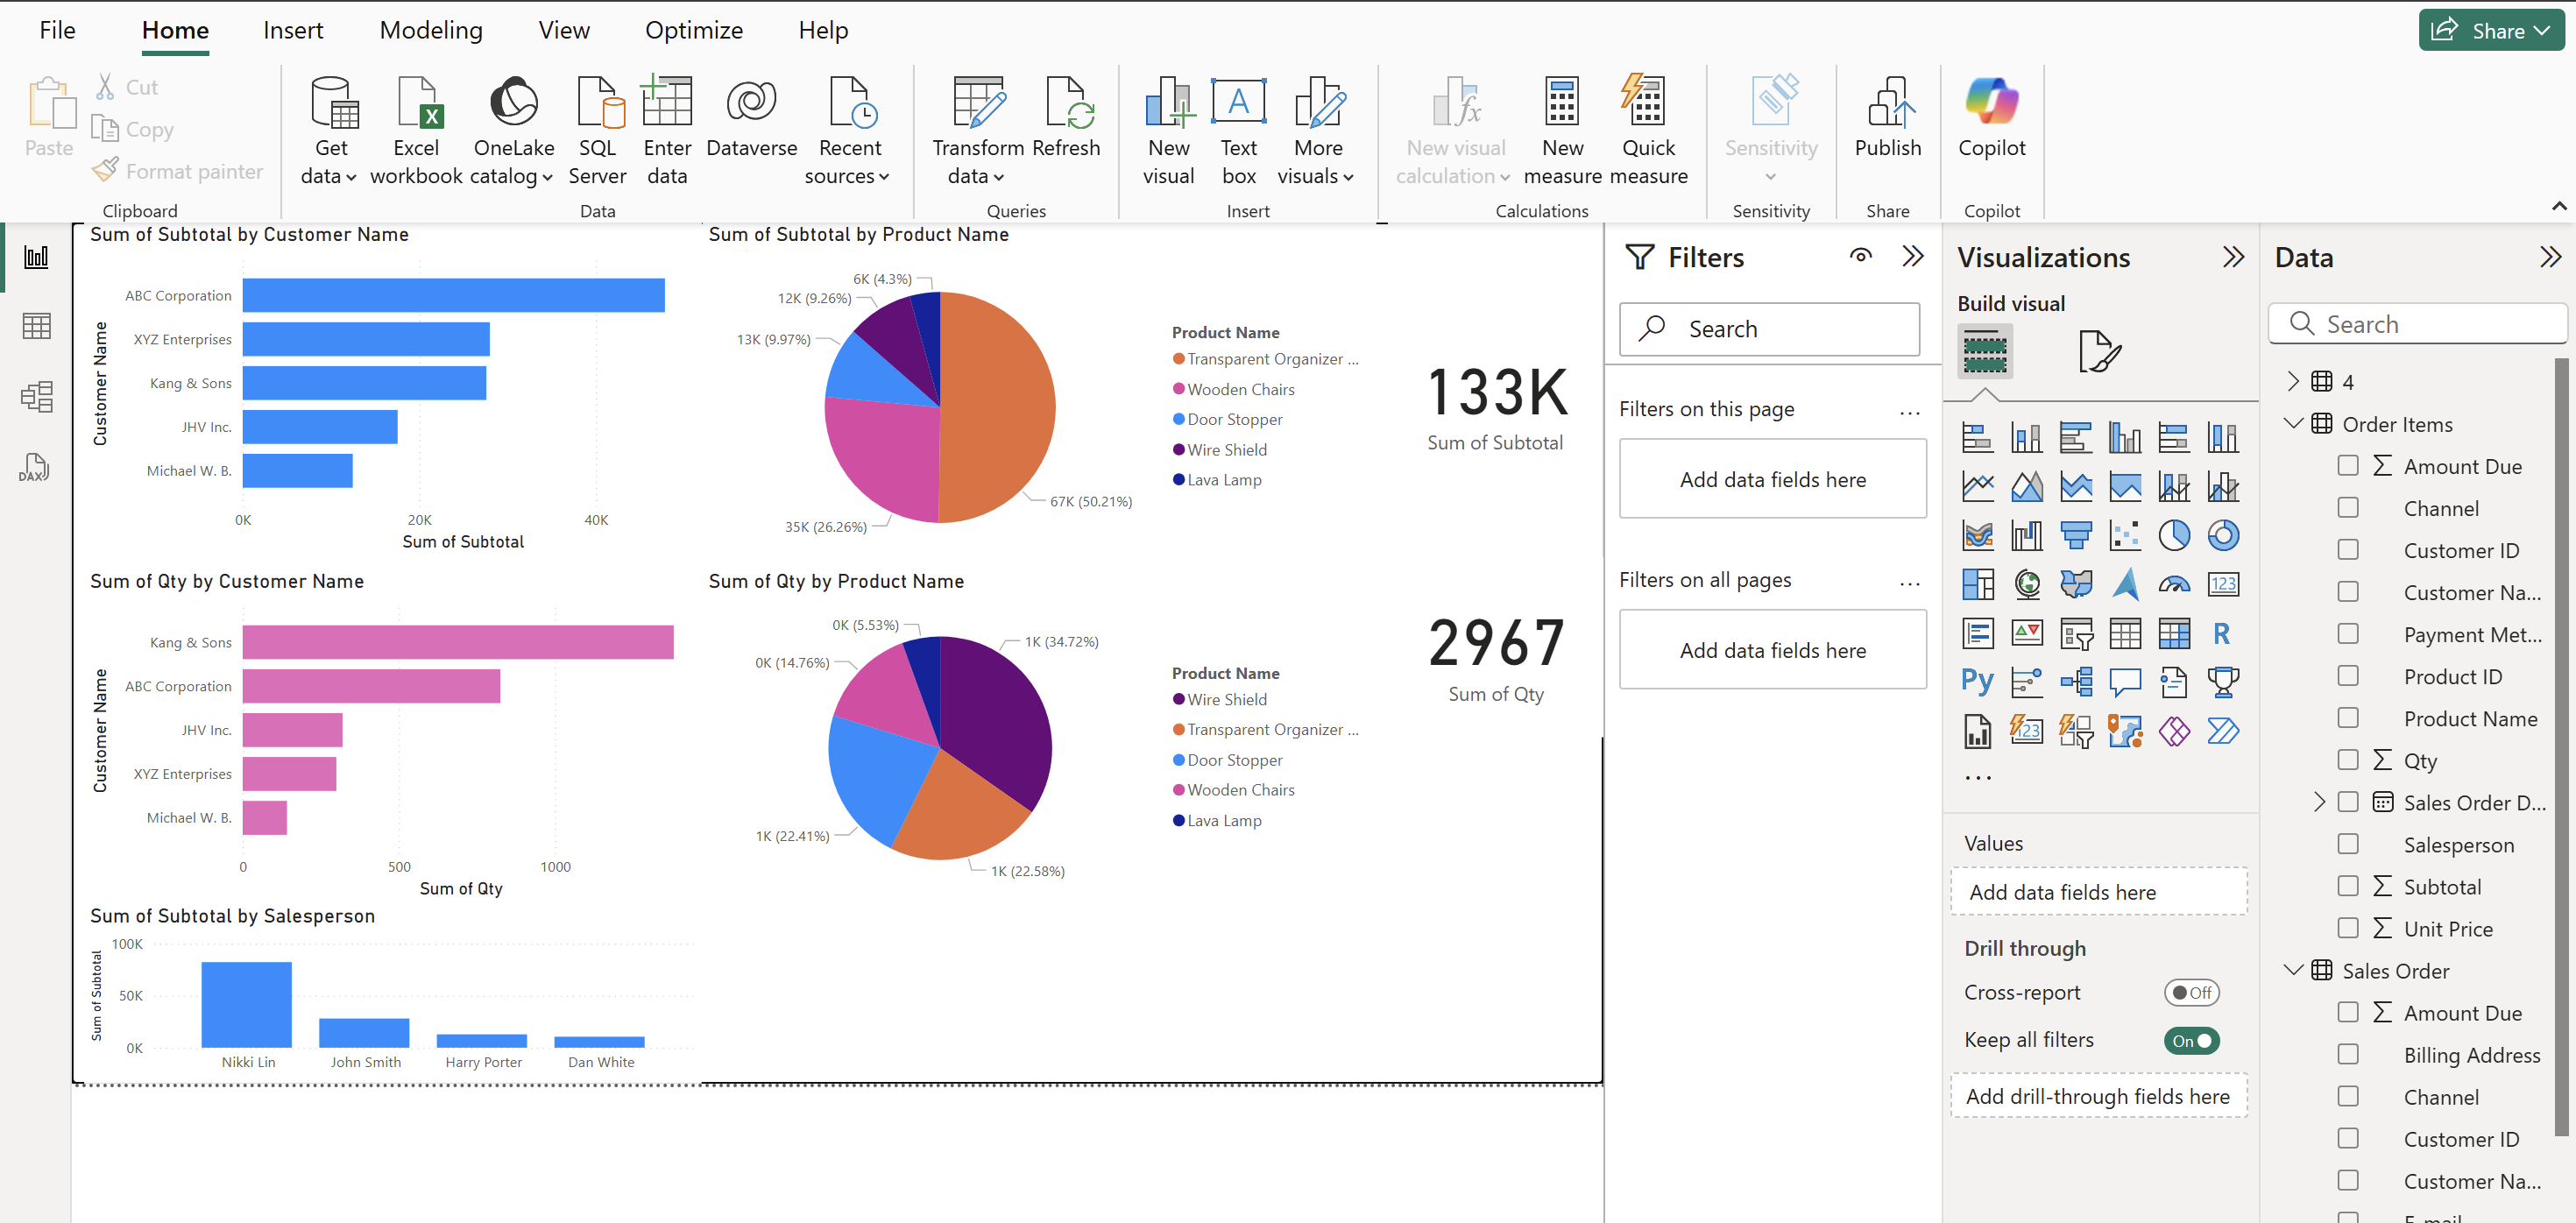
If you have added or removed data from the original data on Ragic, simply click "Refresh" on PowerBI, and PowerBI will download the latest data from the URL and update the data table and charts in real time!