To compare the "proportion of different items within a group" or "percentage differences" of the data in your sheet, you can use the Pie Chart in Ragic Reports. For example, you can analyze the proportion of different customer types, percentage differences in revenue across categories, or compare inventory quantities of various products.
However, be mindful that a Pie Chart may not be suitable when there are too many items or when differences between items are minimal, as this can make analysis difficult.
Note: If you don't see any report options on your sheets, it may be related to your report access rights. For issues with viewing or generating reports, please contact your SYSAdmin to check and adjust the access rights configuration.
In addition to viewing saved reports created by your SYSAdmin in the Reports tab, you can also generate your own reports.
After generating the Pie Chart, the following page will appear. In the upper left section, you can select the field you want to analyze.
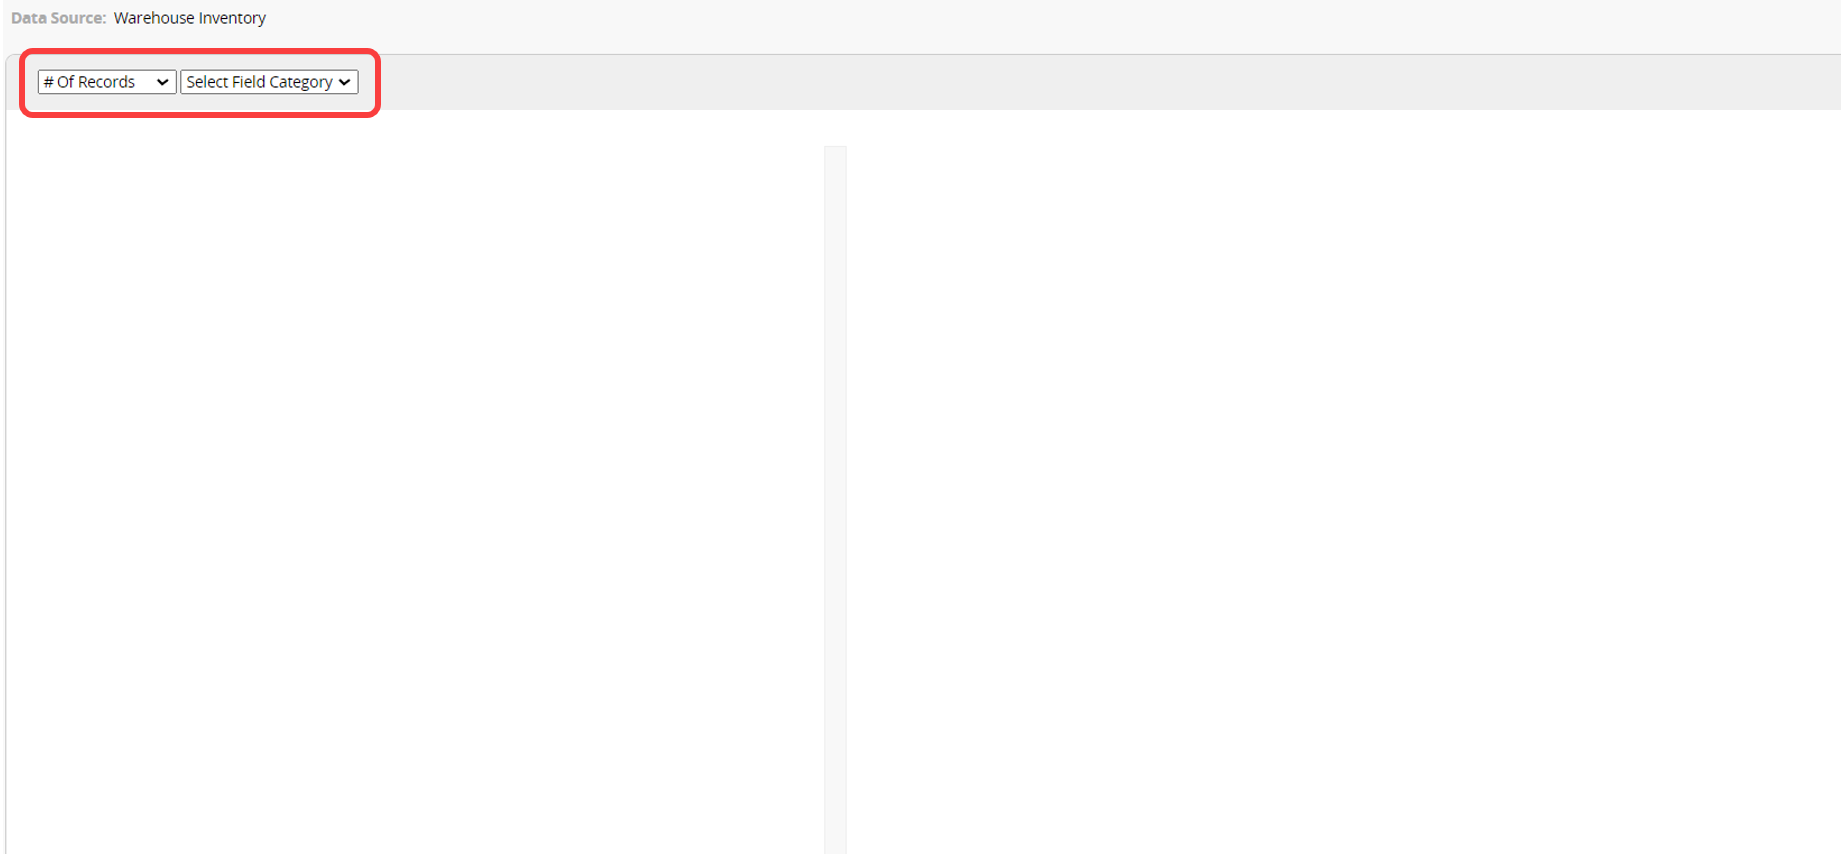
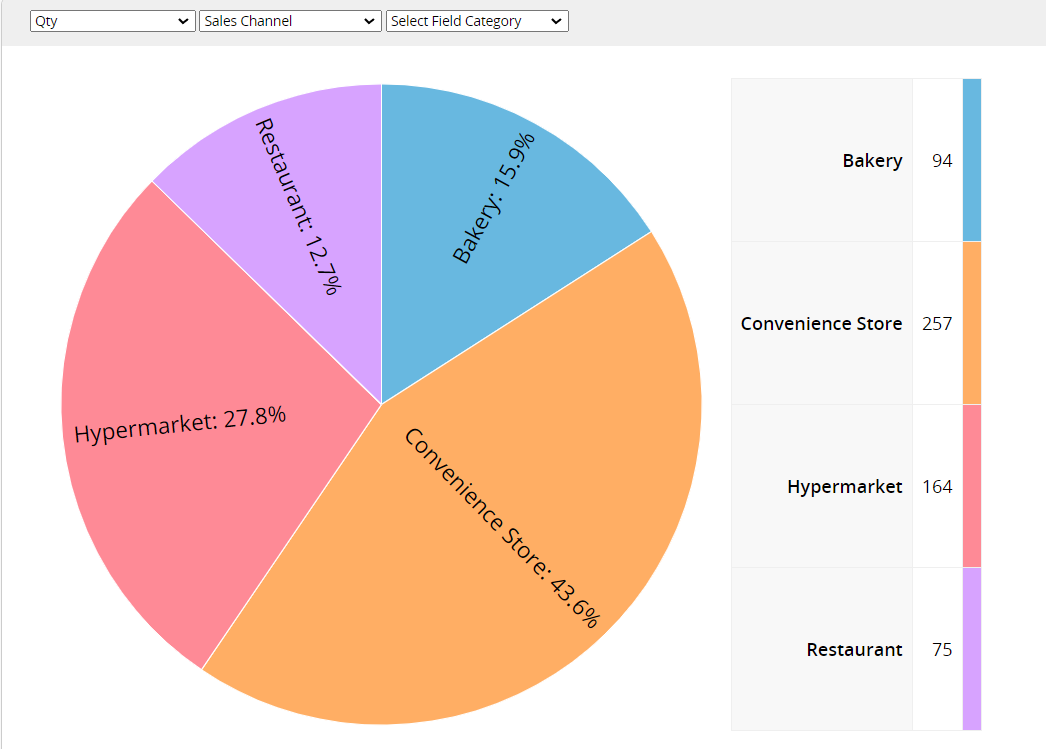
In the first field at the top left corner, you can select the "target value" for analysis, choosing from # of records or Numeric/Money fields from the sheet.
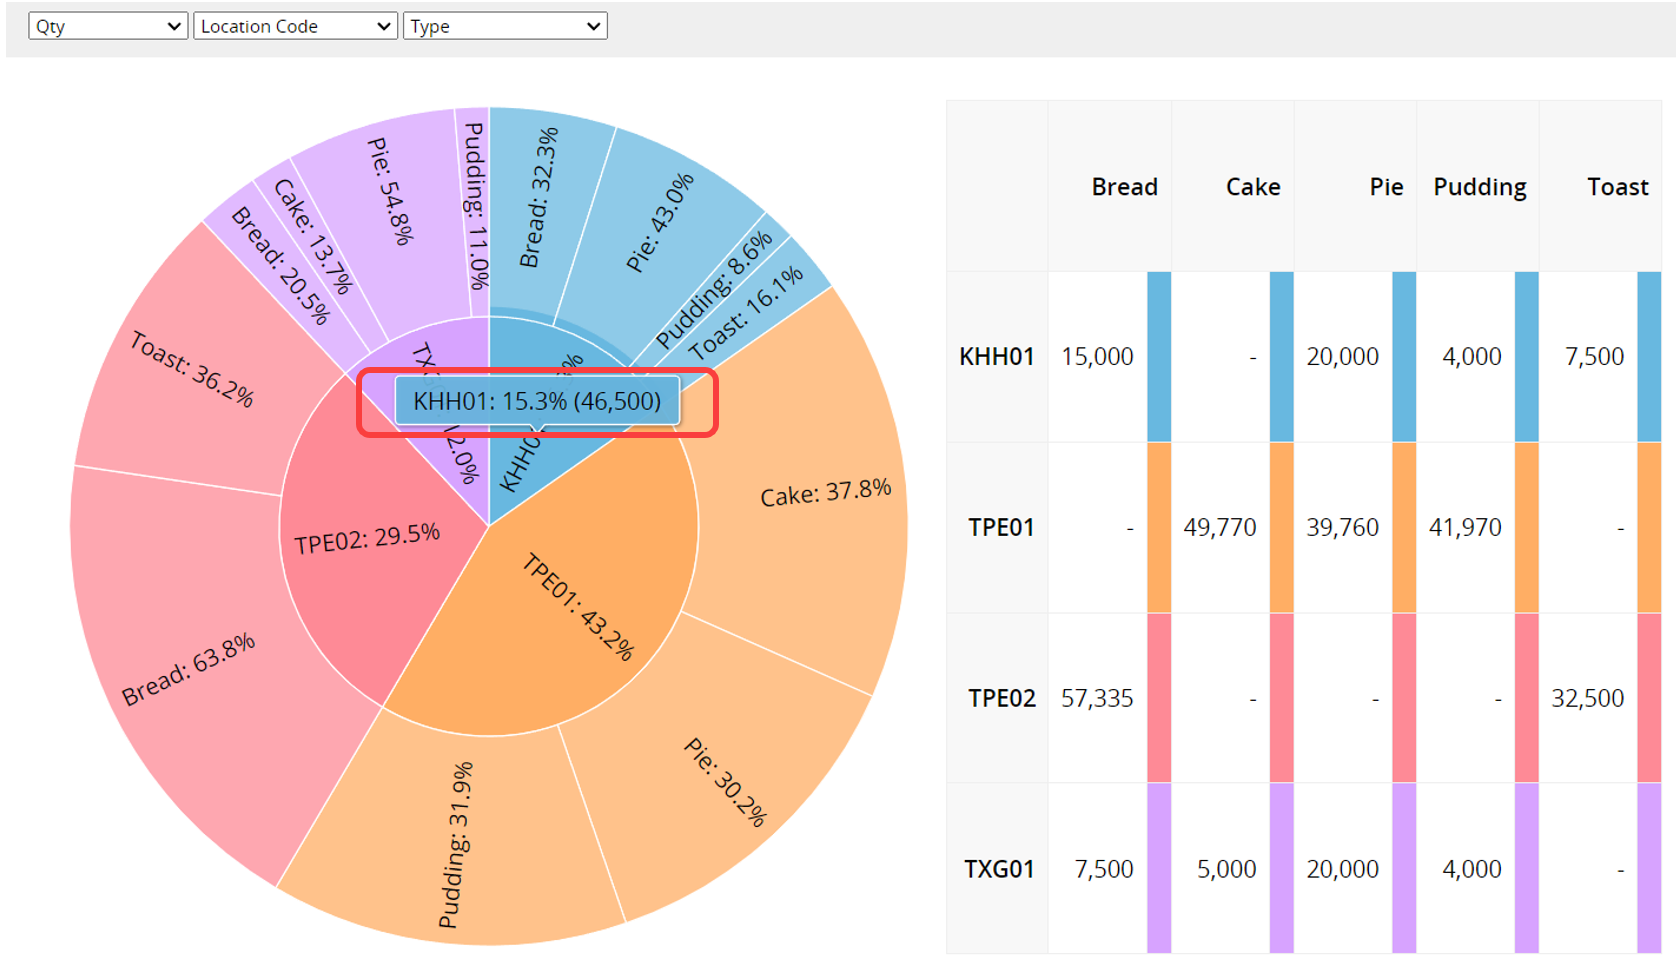
The next field lets you select the field to analyze. After selecting, a second field option will appear on the right. Choosing one field will display a "single-layer" Pie Chart, while selecting two fields will show a "double-layer" Pie Chart.
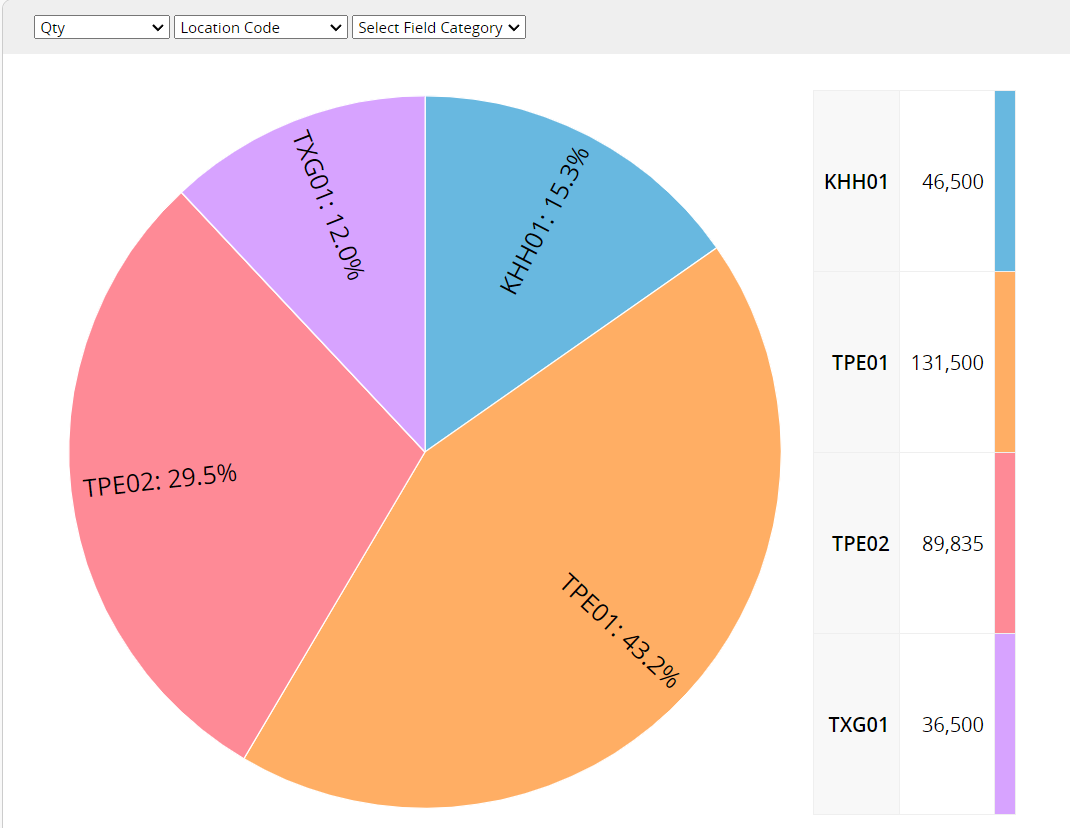
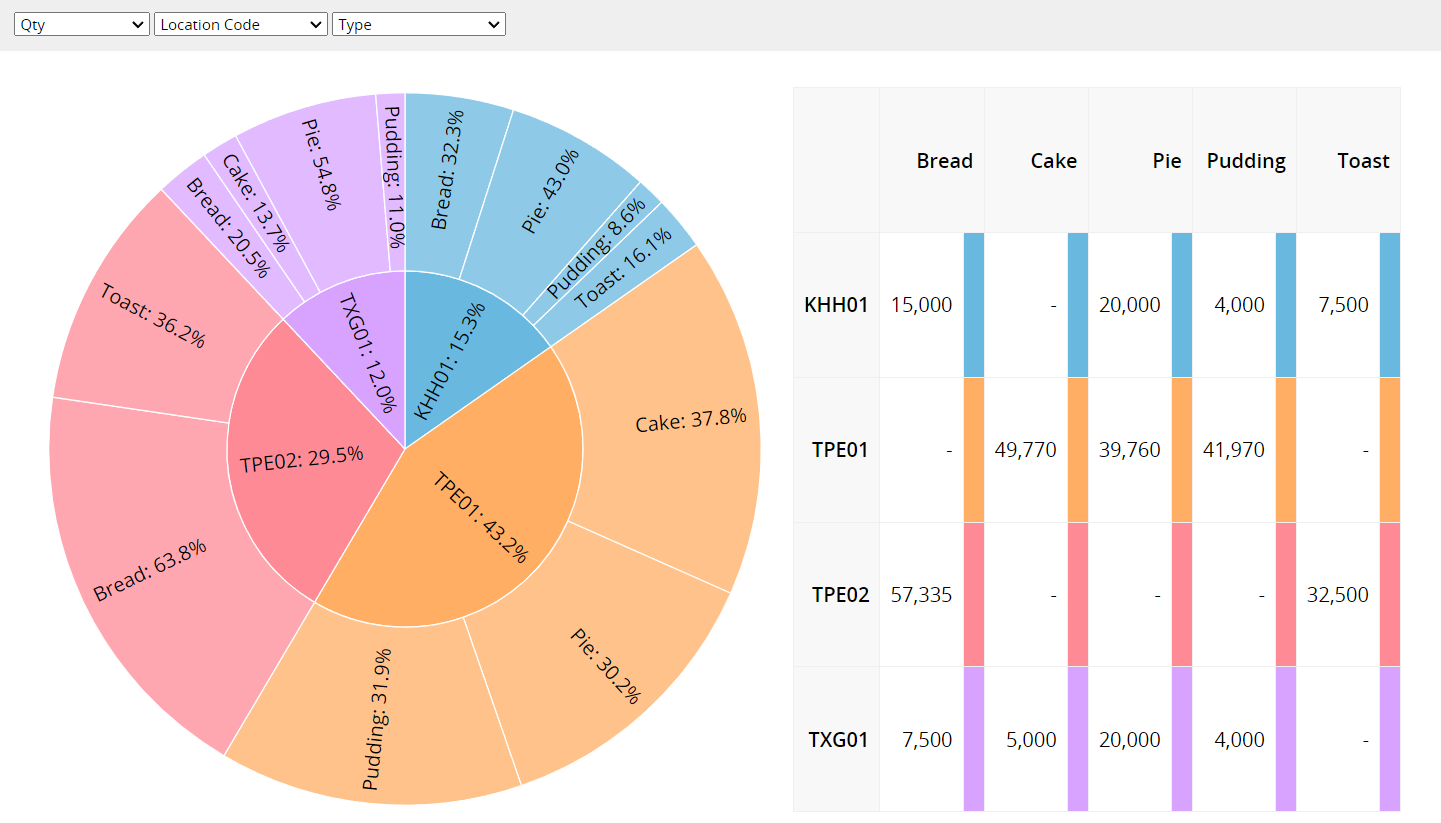
The Pie Chart displays the "proportion of each item within the whole". On the right side, a diagram shows the actual values for each record. Hovering over different segments of the Pie Chart will also reveal the exact value of each item.
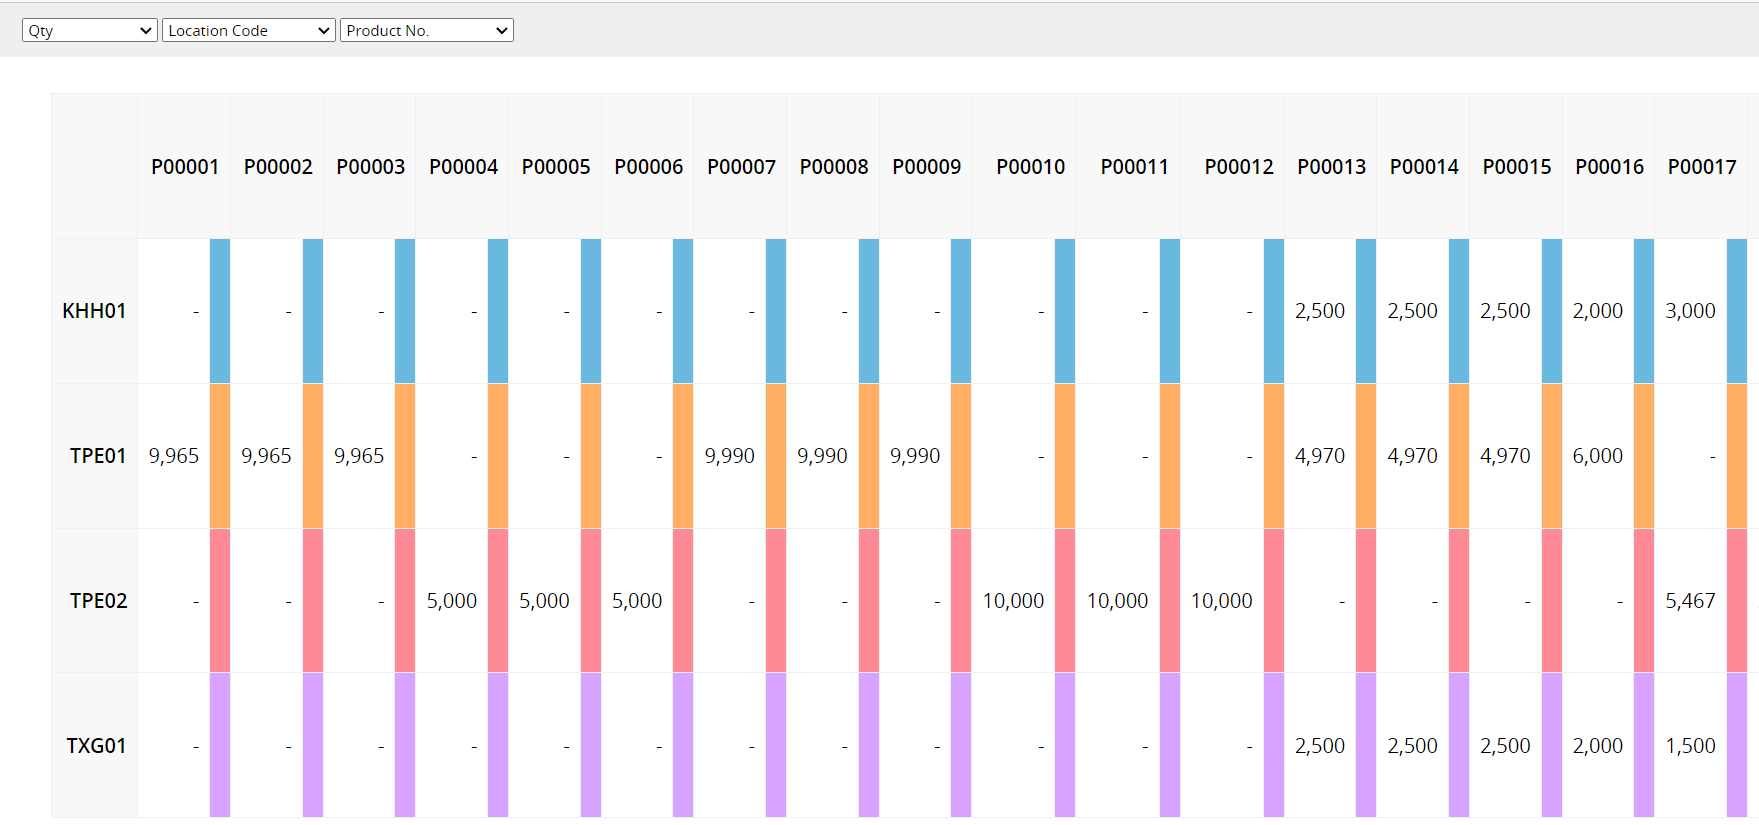
The Pie Chart may not be displayed if too many field items are selected. For example, if you are comparing different types of products across warehouses and choose to analyze the product number field, the Pie Chart may not be shown if there are too many products. Please adjust the settings and select the appropriate options for creating a Pie Chart.
You can use the Printer Friendly or Download as PDF option to export reports.
When your sheet has Shared Views or the Fixed Filter applied, you can filter the report based on those views.
You can embed the report into your website or share a link with others.
You can adjust the report’s style settings, including font, font size, boundaries, etc.

