Intoduction to Data Management (Part 2): The “Ideal" Spreadsheet Format

Foreword
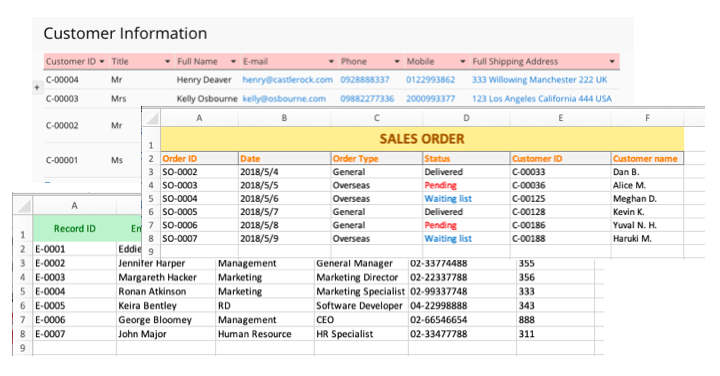
After discussing the nature of different table formats (spreadsheets, tables, forms, pivot analysis table, etc.) in the previous part, this part will provide you tips on organizing data in spreadsheets and adjusting the format for data management and analysis.
Let's first review an important concept...
“Spreadsheet” is suitable for raw data storage. If an online form/ data management/ analysis tool supports importing from or exporting into xlsx and CSV, it is most likely operating in a spreadsheet principle.
...And the basic principles of spreadsheet:
(1) The first row includes the title of the data.
(2) Each row consists of the same number of columns,
(3) The data in the rows under the same column are categorized according to the column name/ title (field header).
(4) Likewise, the types of data in the same row under different columns vary based on how the column names/ title define them.
Note: If you are preparing for data import in Ragic, you can refer to Ragic's file import guide, as well as the tips suggested in this article.

Now let's take step forward to our main topic.
What kind of spreadsheet format is ideal for data analysis?
1.The ideal spreadsheet file format: xlsx instead of PDF or Word
Continuing the concept from Part 1, digital tables can be saved or converted into several different file formats. In terms of document processing in general, PDF, Word, and Excel (sub file name .xlsx) are the most commonly used file format to create tables, followed by CSV and JSON formats. When deciding which format to use, it should be taken into account that each format has a different extent to which data is extracted and analyzed in data management tools.
Let’s take PDF, Word, and Excel files as a comparison. While PDF and Word are indisputably easy on humans' eyes and ideal for reading purposes, this remarkable feature is built upon the fact that human eyes are capable of interpreting the intervals of space, column, paragraph, or cells, which are visually represented in blank spaces, lines, etc. in those file format.
Since computers read and scan data in a completely different manner from humans, those visual cues in PDF or Word file may not always be interpretable by computers .Therefore, file formats that seem pleasant in humans' eyes (like PDF) may not be as preferable for data analysis as Excel in many document processing softwares.
That being said, Excel and other spreadsheet formats are more handy for in-depth data analysis, for each field value is prominently separated by columns and rows. This quality of spreadsheet format enables the computer to, for example in Excel, calculate data through formulas- a feature which does not exist in either Word or PDF.
2. Data arrangement:
2.1. Merged Cells: it is not suggested to deliberately merge cells
In general, each row in an analytical spreadsheet (each record) can only correspons to no more or no less than one value. Therefore, adjusting the spreadsheet’s typesetting, such as merging or deleting cells for the sake of visual aesthetics, may lead to data analysis error.
Let’s take a look at the example below.
Two phone numbers of a company are supposed to be stored under two separated field headers (“Phone Number” and “Extension”). But in this example, the two field headers are merged into one (“Phone Number”). Overall, the table may appear more organized, but the cost of this adjustment is the system’s inability to choose the correct corresponding value when sorting data.

Similarly, merging two rows may also result in query error.

Therefore, since merged field headers and rows may hamper data interpretation and analysis in computer programs, structuring tables based on human visual aesthetic principle is not suggested.
Another inappropriate data organization example is inputing multiple types of data in a single cell (“department” and “job title” in the same cell, for example). In this case, chances of import error may not be significant, but it will hinder the system to independently analyze “department” and “job title” fields.

If the data you wish to import has the above cell format, you may use Excel’s Text to Column Wizard to separate data supposedly belong to different categorizations but are recorded in a single cell. You can also do it in Ragic by applying formulas to extract word roots such as LEFT(value, length), RIGHT(value, length), MID(value, start,[length]) formulas. (Please refer to the list of supported formulas in Ragic for more details).
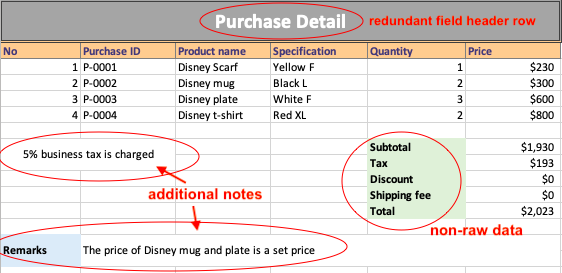
2.2. Remove annotations (comments, remarks, etc.), as well as other processed data (subtotal, etc.)
Unless necessary, adding annotations to your original data or the data you wish to analyze in the spreadsheet (e. g. additional header and notes at the bottom of an purchase detail, as shown in below image) is not suggested.

Such information will be more suitable if displayed in reports or analysis results (after data processing).
User Case
One of the user cases Ragic support team often encounter is Excel file import error (both post-import format error and the inability to import the file to Ragic at all). Like most spreadsheets or form-making softwares in the market, Ragic supports importing Excel and CSV files to your database. Nevertheless, to ensure a successful import, following the import principles and format of whichever software you're using is paramount. In Ragic, although some of the import format regulations may be unique, most of them still adheres to import formats in general.
Below is an example of unsupported import file format in general.

Can you indicate the items in the picture that are incongruent with import formats in general?
Answer:
1. Redundant field header row
2. Merged cells: a combination of one-header-to-many-fields values
3. Categorizing multiple types of data in one header
Basically, files in this format are unimportable. Even if they were importable, we can not be sure of the errors that may occur to both import and data analysis results.
Nonetheless, if your purpose is merely to store data without managing, importing, or analysing them, using the above format won't be a problem. Which is why format adjustment features as merging cells are supported in Excel and other form-making softwares to make your tables look more pleasant in the eyes. (Check out these articles for similar features in Ragic: merging fields, creating static fields).
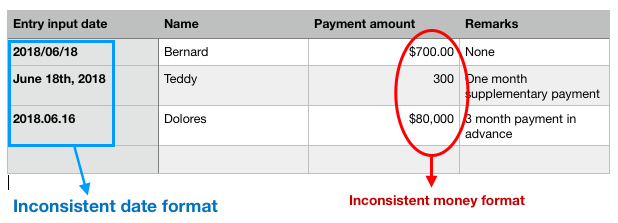
3. Pay attention to format consistency
Also be reminded that inconsistent decimal format, date format, numeric and money format, etc., in your form design may lead to analytical error.

4. Creating a unique value field to identify each entry
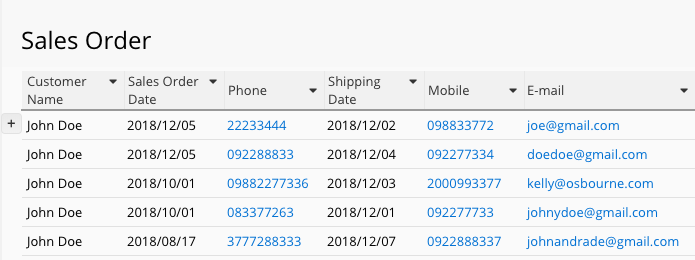
If you need to export, exchange, or link information with other sheets, you will need to create a unique, non-recurring value fields to enable the system to identify each entry and map data to the correct fields.
But if your purpose is solely to store data in spreadsheets or form-making softwares without exporting, exchanging, or linking any information from or to it (read-only purpose), the absence of unique value field in your sheet wouldn't cause you problem as long as you are able to differentiate the fields each entry belongs to.
Example case:
Unique/ key value field in Employee Information sheet
Creating a unique/ key value field (such as “Employee ID”) enables the system to distinguish each entry more accurately rather than fields which may have duplicate values (such as “Employee Name”). Similarly in "Product" or "Inventory" databases, for each product with the same name, “Product ID” would appear to be a more obvious identification than “Product Name”.

Extended reading: please refer to this article for more details on the application of unique value fields.


